Tired of hand-computing all your statistical data analysis? Using Excel’s Analysis ToolPak will help you quickly and easily compute and execute data analysis. Learn how to add this feature to Excel, as well as some Analysis ToolPak functions.
Downloading the Analysis ToolPak
You can now perform statistical data analysis or engineering analysis in Excel by downloading the Analysis ToolPak. The tool pack will use the information that you provide to decide which macro-functions will best work for your problem and output the information into a table or a chart.
Before you can start inputting your information, you will need to download the Analysis Toolpak if it is not already installed in your version of Excel. To do this, follow these steps:
- Open Excel.
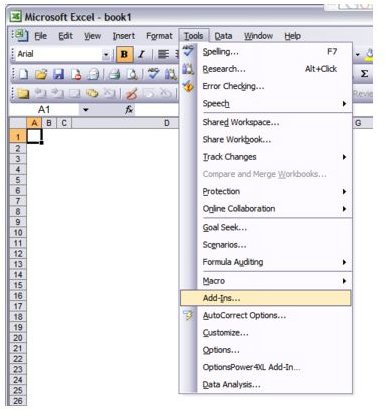
- Go to Tools -> Add-Ins.
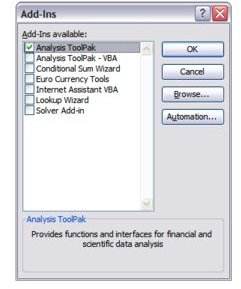
- Check the box next to Analysis Toolpak.
- Click OK, and the tool will install automatically.
Now all you have to do to use the tool pack is go to the Tools menu, and click on the Data Analysis Tool.
Anova and Correlation
There are different types of tools available in the Analysis Toolpak. While the computer will generally use the information that you provide to automatically pick the best macro-function for your data analysis, it will be helpful to you to know about the available tools. This article will give you an overview of Anova, Covariance, Descriptive Statistics and Exponential Smoothing. Future articles will give an overview of the remaining tools.
Anova
This tool is generally used for variance analysis. The Anova tool is broken down into three parts: Single Factor, Two-factor with Replication and Two-Factor without Replication.
The Single Factor is a simple statistical analysis of two or more samples. You can test an underlying probability distribution hypothesis against its alternative. If you simply need to test two samples, you can also use the TTEST function.
The Two-factor with Replication function is used for two-dimensional analysis. For example, if you want to test the bloom rate of a flower, you may give it different brands of fertilizer and keep them at different temperatures. For the six different possible combinations, you can keep track of how the flowers are doing.
The Two-factor without Replication can also be used for two-dimensional analysis, but you are only observing one single factor for each pair combination.
Correlation
The Correlation uses the Correl and Pearson worksheet functions. These functions correlate the coefficient of two variables as measurements on taking measurements on a set of subjects. It’s best to use the Correlation analysis tool when each subject has more than two variables. When these calculations are outputted, you will get your output table plus a correlation matrix which will the value of the Correl in relation to each pair of variables.
Covariance and Descriptive Statistics
Covariance
The Covariance function is similar to the above function. It allows you to see measurement variables on an observed set of subjects. Here, you will again get your output table and matrix. What sets this function apart from its predecessor is that the coefficients will range between -1 and +1. This will measure how much a correlation coefficient and the covariance will vary together. This tool will use the COVAR function for each set of measurement variables.
Descriptive Statistics
This tool will create univariate statistics report for data within an input range. With the Descriptive Stastics Tool, you can glean information about central tendency and data variability.
Exponential Smoothing
Exponential Smoothing
If you need to forecast, this is probably the tool that you will use. This data analysis tool allows you to predict a value based on what has gone on before and will adjust the figure based on past errors. This tool will use the smoothing constant A to determine the scale with which a forecast will be determined by the errors in the previous forecast. The best forecasting value range is 0.2 to 0.3, indicating that your forecast needs to be amended by 20 to 30 percent. While you may be able to get quicker responses with larger numbers, you results could be unpredictable.
For more information on the Analysis ToolPak, read Using Excel for Statistical Data Analysis .
This post is part of the series: Data Analysis ToolPak
Got a lot of data to deal with? Well, Excel has just improved your life with the Analysis ToolPak. These software tools allow you to easily and quickly compute and output statistical data analysis and engineering analysis functions.


