Excel is a great tool for many things, including statistical data analysis. Learn how to use Excel’s Analysis ToolPak to help you calculate statistical data. Plus, learn about the pros and cons of using this tool.
Analysis ToolPak
Excel is a great tool to use for rudimentary statistical data analysis. The newer versions come with an Analysis ToolPak just for this purpose. Plus, a trial version of Excel comes with most computers out on the market. If not, you can always download a trial version from the Microsoft Web site.
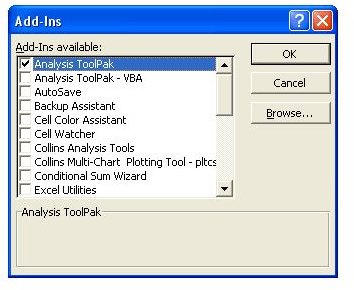
If your version of Excel does not come with an Analysis ToolPak, you will need to install it. You can go to your Search feature in Excel, do a search for Data Analysis ToolPak, and obtain instructions on how to install it on your computer. The Analysis ToolPak allows you to input statistical data and parameters, and then it uses macro functions to calculate the information and create an output table with the finished calculations.
Creating a New Worksheet
Before you start your statistical analysis, you need to create a new worksheet. To create your worksheet, follow the below instructions.
1. Go to File → New Worksheet.
2. Right click on Sheet 1 at the bottom, and click rename.
3. Rename your worksheet.
Using the Analysis ToolPak
Once you have your new worksheet open, go to your Analysis ToolPak in the Tools menu. Here is where you will find procedures for statistical analysis in Excel. Some of the types of statistical analysis that you can do include simple descriptive statistics, correlations and t-tests. You
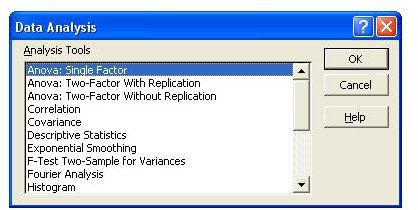
can also use the Data menu to create Pivot Tables, which you can use to create standard deviations, summary tables and other similar tables.
Another handy tool in Excel is the functions feature. You can use these to create statistical measures. You will only get a single number when using this feature so you may have to put together a bunch of numbers to get the figure that you need.
Creating Your Own Data Table
If you wish to create your own table for your data, you can do this as well. To create your own table, use the following commands.
1. Select the number of cells (the squares on the sheet) that you need to create the adequate number of spaces to put your information into.
2. Go to the Insert Tab at the top.
3. Go the Tables group, and click Table.
4. Or, you may press CTRL+L or CTRL+T for shortcuts.
Each of your rows could represent one of your subjects, and the columns can represent what you are testing and outcomes.
For more information on using Excel for calculations, read Tricia Goss’s article Using Data Validation to Make a Dropdown List in Excel.
Problems with Using Excel for Statistical Data Analysis
While the Analysis ToolPak can be used for simple calculations, it might not work for more complex calculations. The first problem that you may encounter is that the Analysis ToolPak doesn’t come with every version of Excel. You will have to install it if you don’t have it.
The second problem with using Excel for statistical data analysis is that there is no place to put missing data. You will just have to leave the cell blank. If you have to conduct several tests, the way that Excel arranges data may not work for you. You will have to keep rearranging that data to fit your needs.
The final major issue is Output Location. The default for this is a New Sheet. While this may work for simple statistical data analysis, it could become cumbersome if you are doing many tests. You will have a ton of sheets with only a little bit of information on each sheet. You can also designate that the information be placed in the upper left corner cell. But, you may not have enough room for your notes. The third designation is New Worksheet, but you’ll run into the same problem of having many worksheets with little information on them.
Using Excel for statistical data analysis may work for those interested in running a simple test or even for the average college or high school student’s statistical data analysis projects. But, you will have to play around with the Analysis ToolPak features if your statistical analysis is more complex.
To learn how to automatically update your Excel program, read Microsoft Excel: Have Web Data Update Automatically Every Two Minutes by Mr. Excel. Also, you might want to take a look at the collection of Excel chart and graph tutorials available on Bright Hub’s Windows Channel. With these tips, you can quickly and easily create a chart to make your data easier to understand and interpret.


