Even if you’re not preparing a full business plan, it’s important to develop certain financial goals and reports. In this guide, we’ll show how to use Excel to produce a sales forecast that can be as simple or complex as you need it to be.
What Numbers Do You Need?
There’s a popular misconception among many business owners that you need a solid background in finance, accounting or some other discipline that deals a lot with numbers in order to develop a sales forecast. In actuality, all you really need is the ability to make relatively good “guesses” based on the information you have on hand.
Of course, more information tends to lead to better guesses, but in the end, a sales forecast is simply your best guess of how much money you’ll make in sales over the forecast period. Business planning software progams, such as Business Plan Pro , generally include some type of tool that will help you develop a sales forecast. However, it’s just as easy to create your exhibit in Excel – or almost any other spreadsheet application, for that matter.
With that in mind, it’s still important to be able to explain what logic you used to come up with your guesses, especially if you need to include the forecast in your business plan or defend it to business partners or potential investors. Here, we’ll take a look at how to develop a simple sales forecast in Microsoft Excel 2007.
Even though we’ll just be constructing a very basic forecast, you can easily expand on this forecast and the methodologies used to develop it to incorporate more complex situations. The Excel forecast and spreadsheet that we are developing here is available in the Entrepreneurship Media Gallery under the title Sample Excel Sales Forecast . You’re welcome to download the file and modify it to suit your own business planning needs.
Creating a Table
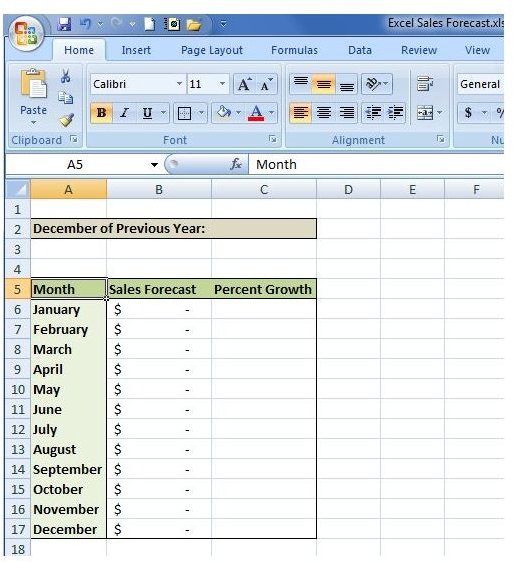
Step 1: Begin by setting up a small table in Excel that includes columns for Month, Sales Forecast (in dollars), and Percent Growth as shown in the screenshot below. (Click any image for a larger view.)
If you’re an existing business, it can also be helpful to include the actual sales figures from the most recent month. If you don’t have this information on hand or if you’re a new startup, you can delete this field on the template.
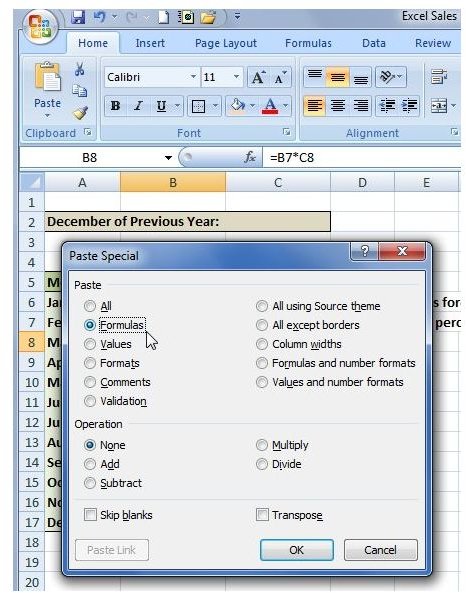
Step 2: With this template, instead of entering in dollar amounts for each month, we’re going to base the monthly forecast amounts on expected growth. So, for each month (February - December), we’ll insert a formula that will compute the sales forecast for that month based on growth and the prior month’s forecast. For example, the formula entered into cell B7 (the sales forecast figure for February) will be the following:
= (B6 * C7) + B6
Once you enter this formula, you can copy it and use the Paste Special command to paste only the formula into the other cells in column B.
Creating a Sales Forecast in Excel (continued)
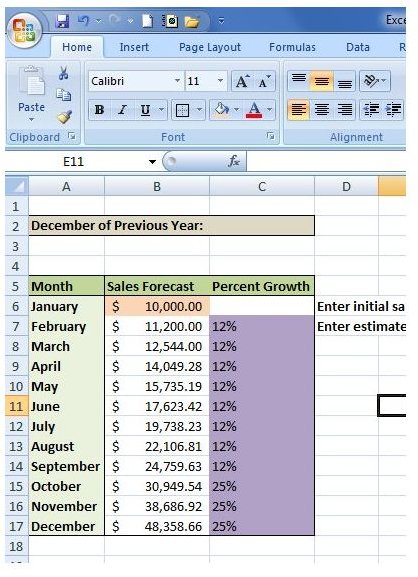
Step 3: Now, we need to enter a couple of our “guesses” into the table. First, we’ll need a sales forecast for January, the first month of our table. As an example here, we’ll just enter $10,000. Yes, this is a guess, but generally it is a lot easier to guess how much you’ll make in sales during the first month of business that it is to guess what you’ll be making six months down the road.
We also need to enter a percent growth for each month. Depending on your business type or plan, these values might be different for each month. For instance, if you’re a seasonal business that sells swim wear, your growth will most likely be higher in the summer months. Similarly, if you plan to throw a lot of money into advertising in the autumn months, your growth will tend to be higher there as a result. For now, we’ll assume a steady growth rate of 12% throughout most of the year, but we’ll up that to 25% for October - December to indicate the upsurge during the holiday shopping season due to an increase in advertising and more customers shopping during those months.
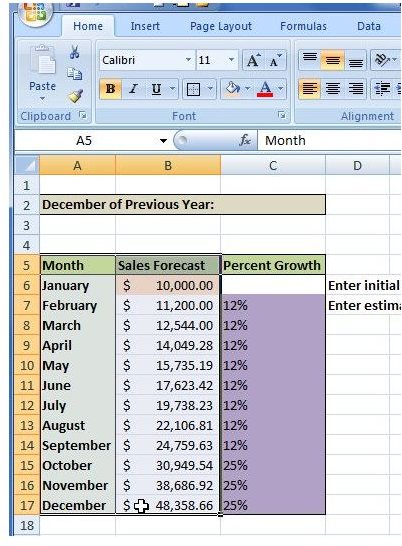
After entering this information, our sales forecast numbers will automatically calculate and we’ll obtain a table like the one shown below.
At this point, if all you wanted was a table with the forecast data, you’re basically done. However, it’s generally a good idea to create a chart as a visual representation of the data in your table to accompany your forecast. We’ll go on to do that.
Generate a Chart
Step 4: Select the Month and Sales Forecast columns of the data table.
Step 5: For this example, we’ll create a simple line chart. To do this, go to the Insert tab on Excel’s ribbon, select Line from the Charts grouping, and pick the first line chart.
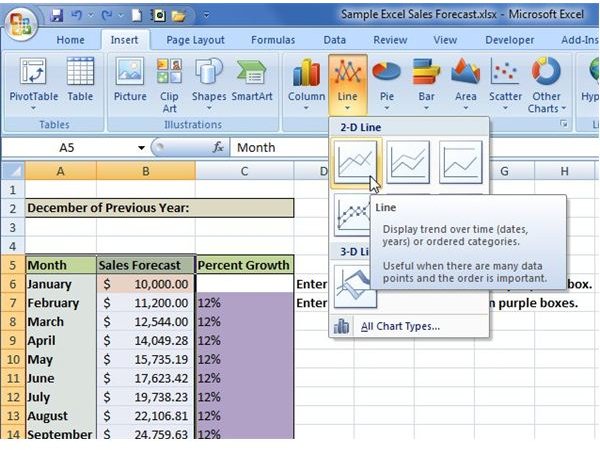
The initial line chart will appear as shown in the screenshot below.
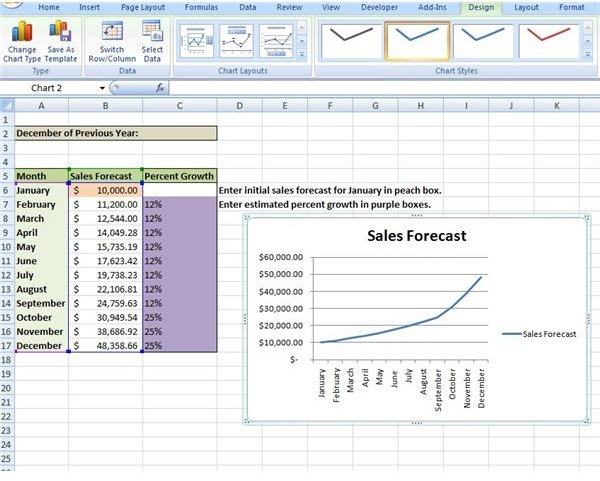
You can drag this chart around to any other position on the Excel spreadsheet, or you can even move it to a completely new worksheet .
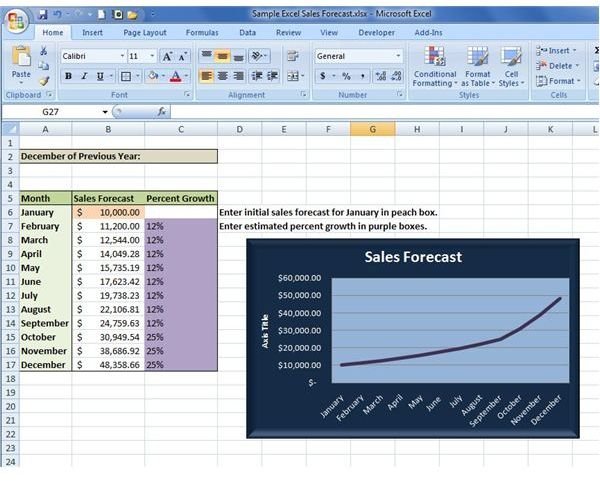
Step 6: In its present condition, the chart isn’t very eye-catching. However, you can modify the formatting and design of this chart just as you would any other chart in Excel. For tips on how to do this, check out some of our other Excel chart tutorials at Bright Hub. Below is one example of the many design changes you can make for the chart.
You may also want to take a look at How to Measure the Accuracy of a Sales Forecast for some tips that will help you determine how accurate your forecast model is.


