With scores of investors who do want to build a firm, rock-solid foundation to their wealth, bonds have been an inevitable way to do so. Like they say, “Information is the key to success”; if it is, well, you will have to know how to read monthly yield bond tables in newspapers. See how to do it now
For an intelligent investor, information would mark success. The ability to draw information from various sources, each day, all the time, throughout the year and then act on it will determine her success.
When it comes to bonds, you would start by checking out the prices of these securities (assuming that you already own bonds and would like to trade them). If you are looking to buy bonds directly (as a first time owner), perhaps you should read this article titled Bond Basics: How to Pick up Bonds.
So just as you would check to see what your assets would fetch when you float them out in the market, bonds can be checked out too, if you knew where and how to look. The main information you would be looking for would be to find out what might be the cost of a new bond to be purchased or how much you might expect to receive if it got sold on the market.
The morning newspaper is one of the easiest and well-chronicled sources for the above mentioned information – the likes of The Wall Street Journal, Barrons Guide, etc.
The point is that there are so many bonds outstanding on the market that a huge, bound book also wouldn’t be able to list all of them exhaustively. Fortunately, it is not even required. Not many bonds are traded really and hence that isn’t what drives the prices here.
The Interest rates, a key factor that brings about the changes in similar bonds and the Bond’s credit quality, reflected by the bond ratings.
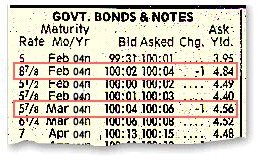
If you notice the image above, you would see an example of a newspaper would publish the treasure bonds information. Here’s what you can read out from the image:
-
The first column you see to the far left is nothing but the coupon rate - the percentage of par value paid our as interest annually. Note that the bond high-lighted at the bottom pays out 5 7/8% Interest every year.
Advertisement -
The second column displays the maturity date and shows when the bond is going to mature. In this example, the bond matures on Feb ‘04
-
The next column and the one after that quote the prices of the bond in question. These prices are quoted as Bid and Ask prices – bid price is the highest price offered for the bond and “ask” is the lowest price the sellers would agree to pay for it. The prices are percentages of the bond’s face value pegged at $1000. So 100:04 means that the buyer is wiling to pay $1000.12 and the ask price of 100.06 is about $1001.87
Advertisement
Note: The bid and ask prices are calculated in 32nds. So when the price is displayed as 100:04 we take the value after the colons and divide by 32 and then multiply by 10 (04/32 = 0.125*10 = 1.25) and append this value to the number before the colons (so the price is now $1001.25)
-
Bid Change just displays the change in the price of bidding price since the close of the market the previous day. A positive change is shown with a little ‘+’ sign and decrease since the previous day is shown by a ‘- ‘sign.
Advertisement -
The last column is that of an ask/yield or also called as the ‘yield to maturity’ column which represents the relative value of the bond. The yield to maturity equals the internal rate of return on a bond. Which is fairly complicated to calculate, if you wanted to know how to arrive at it. It shows the percentage return on investments made. That means, it would show the percentage profit/loss an investor, who had purchased the bond at par when it was issued, would make if she sold the bond today.
This post is part of the series: Bonds, Fixed Income Securities and Debt Markets
Everything about bonds, bond markets, interest rates, debt markets and investing tips can be found in this series.


