Excel is the most commonly deployed spreadsheet package in the world, partly because it comes as part of Microsoft Office. This is a lesson plan for an intermediate training course for Excel for Windows 2007. It takes account of changes in the 2007 version including the ribbon interface.
Learning outcomes
At end of an intermediate training course in Excel, a learner should be able to use some of the more advanced features of the Excel application. This Microsoft Excel lesson plans guide will equip learners to handle tables, images and charts and to build the whole presentation using slide animations and transitions. It assumes knowledge of the learning outcomes of my basic lesson plan for Excel 2007 . That’s why we start with learning outcome 4.
Learning Outcome 4: Creating Charts from Worksheets
A learner should be able to create a variety of Excel charts from data stored in worksheets. This will require them to:
- select the correct data range to construct a chart from data stored in a worksheet;
- select a column, line, pie, bar, area scatter chart type option from the charts section of the Insert tabbed ribbon;
- select a stock, surface, doughnut, bubble radar chart type option from the other charts option in the charts section of the Insert tabbed ribbon;
- use the [F11] keyboard shortcut to create a quick chart;
- select 2-D, 3-D and other subtypes of major chart types from the charts section of the Insert tabbed ribbon;
- use the chart tools ribbon to refine the chart type and design;
- use the Move chart option in the Location section of the Design ribbon to select whether the chart is embedded in the worksheet or stored as a separate sheet in the workbook; and
- use the short menu to refine and adapt a chart once created to edit and format data series, axes, titles, background and grid lines.
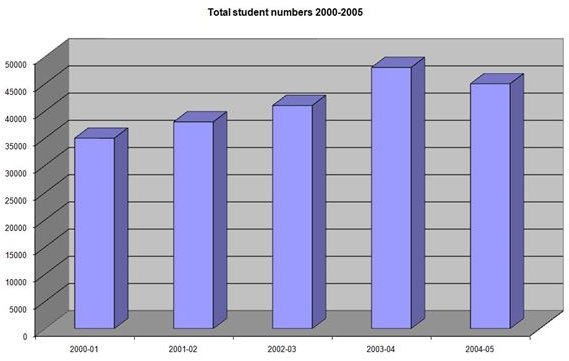
Charts in Excel
Learning Outcome 5: Data Types and Predefined Functions
A student should be able to handle a range of different data types and the predefined Excel functions to manipulate them . This will require them to:
- understand the general, number, currency, accounting, date, time, percentage, fraction, scientific and text data categories;
- format cells according to the relevant data categories using mouse to select cells and the short menu to select the Format Cells option or the relevant section of the Home tabbed ribbon;
- understand the Math and Trigonometry, Statistical, Financial, Engineering, Information, Date And Time Logical, Database and List Management, Lookup and Reference, Text function categories;
- insert a function from the Formulas tabbed ribbon bar using the Insert Function, AutoSum, Financial, Logical, Text, Date And Time, sections of the Function Library;
- complete a function using the correct arguments and select the relevant cell values by means of mouse or keyboard; and
- validate a function using the Audit Function facilities on the Formulas tabbed ribbon bar.
Further Microsoft Excel lesson plans will define training programs to equip learners to use productivity aids such as pivot tables, macros and database functions. For lots more information about Microsoft Excel 2007, check out the other items in Bright Hub’s Where Can I Find Free Excel 2007 Training and Tutorials .


