Knowing what’s going on with your hosted website is crucial to ensuring that uptime is stabilized, TCP ports are set without open vulnerabilities, database stores are functioning properly and that everything is running like it should, and Tenable Nessus detects and shows it all by level of severity.
Introduction
Knowing what’s going on with your hosted website is crucial to ensuring that uptime is stabilized, TCP ports are set adequately and without dangerous vulnerabilities and that everything is running like it should. You may also want to ensure that your website database functions relative to server-executed application scripts (like Drupal or Joomla) can properly access their database stores (like with MySQL, for instance). Tenable Nessus does all of this and displays it online using a concise, easy to browse interface that shows what’s good and what’s not exemplified from low risk to excruciatingly high. So how does one use Nessus to run a scan for these potential issues?
In our general overview of using Tenable Nessus , we ran an overview of the client interface across all four main functions of the software. In this guide, we’re going to get into the meaty core of actually running a Nessus scan.
Getting Started
The first order of business is to access the client interface (assuming you have everything set up properly) by typing https://localhost:8834/ into the provided space in your web browser. (Don’t freak over any security errors, though – Nessus is totally harmless.) Next, be sure to log in with the administrator account for adequate results. Note that I will be leaving out the username herein for my own privacy, but make sure that you actually specify your log in using the spaces provided, and click login as pictured:
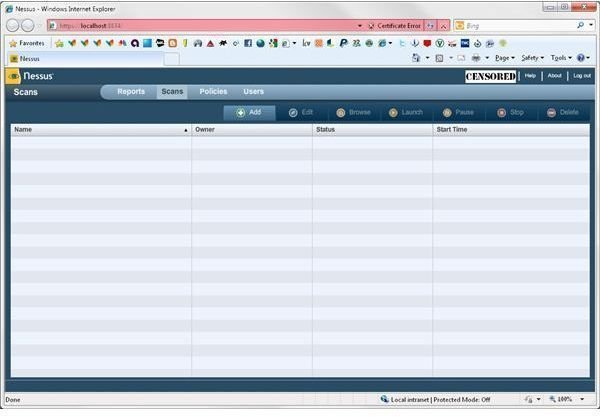
Once you’re in, you should arrive at the reports screen as pictured:
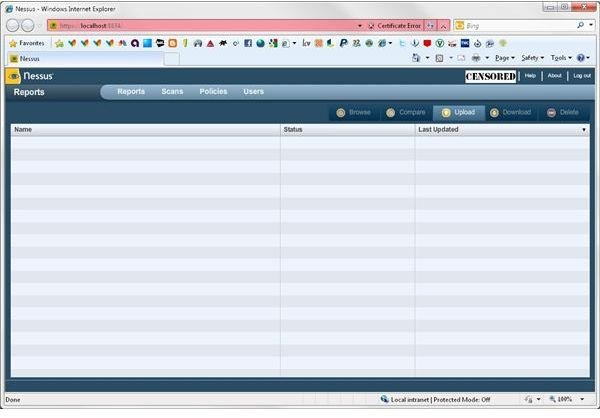
As described in our Using Nessus Scanner guide, the top rows of the navigation bar encompass the means to access the functions of the scanner interface. The three options in the top row are unnecessary for this guide – and we certainly don’t want to log out prematurely, either. Just turn your attention to the bottom row of the navigation bar, which links up the four screens we can access, as well as the name of the current screen as pictured below:

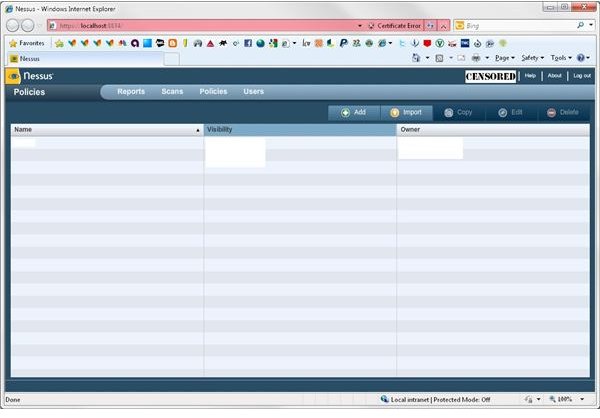
Before we proceed further, we need a scanning policy established before we can actually run a scan for the first time, so click Policies (it’s the third item from the right within the light blue area of the second row). You should arrive at the following screen:
In the next two sections we are actually going to add our first scan policy.
Steps One and Two of Creating a Policy
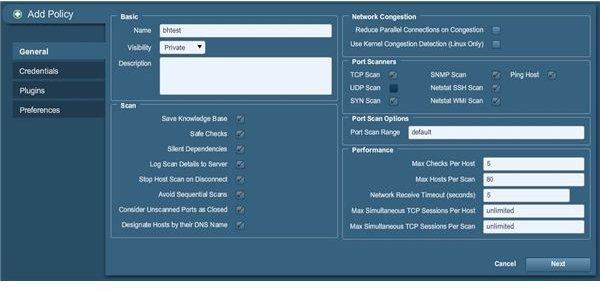
Begin the procedure of adding a policy by clicking the Add button. You should see the following:
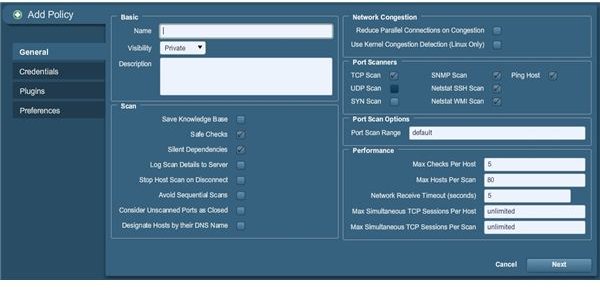
Now enter the basic details for the scan here before we proceed. We need to name the scan policy of course, so put that in. We are going to use bhtest for this example; you can name yours practically anything. The scan options default to using safe checks and silent dependencies so leave those as is; we probably shouldn’t mess with those. Ensure that consider unopened ports as closed is checked as well, since we want to have clean results without unneeded filler, and littering the results with false positives just ain’t in our best interests here. You may as well check the options to log scan details to server, stop host scan on disconnect and to avoid sequential scans for the purposes of using failsafe processing and (in the case of the scan log) to have future reference later. Saving to the knowledge base – and using the options to the right – can be done as you wish, as it doesn’t hurt either way. Your display should reflect the adjustments like this:
Click Next, and you will come to the credentials specification screen as pictured below:
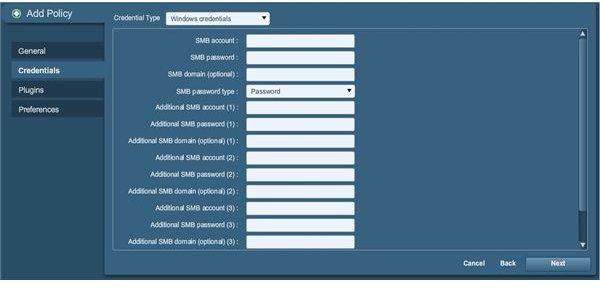
You may actually be able to leave this blank, if you can believe that one. As such, we’re going to skip this and click Next again. (You can always add the information later if you discover that you actually need it by simply clicking the policy after creating it and clicking edit to repeat this process with esisting information already filled out.)
Continued: Steps three and four of the policy builder, and running our first scan
Steps Three and Four of Creating a Policy
After clicking Next, you should come to the Plugins selector as pictured below:
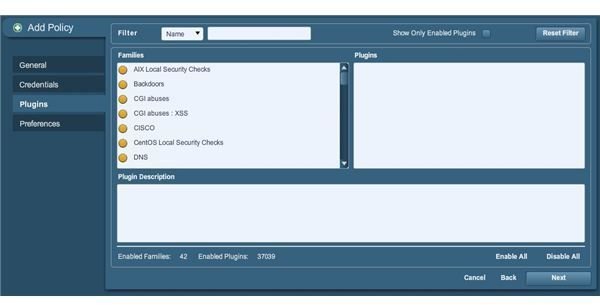
In most cases, you don’t need to specify the use of any plugins (we sure aren’t going to here, but your situation may differ in which case you can check of any plugins you desire, or all of them if needed). So let’s go ahead and click Next to proceed to the final step of adding our first policy, as shown below:
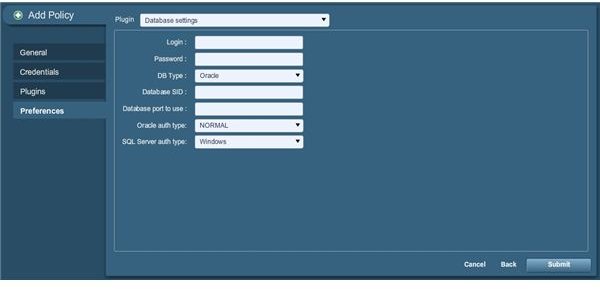
As you can see, we are now going to set plugin options. Since we didn’t set up any optional plugins (which is why that wasn’t a typo in the picture caption) we only have the basic scan procedures to configure. The only one of note here is the database settings, so let’s configure that real quick. For the example here, we are going to use a MySQL scan profile so change the database type accordingly to get the result shown below:

We’re done now, so click Submit and our policy will display in the list as shown below:
Configuring a Scan
We are now ready to scan a URL for database and server compliance. Go to the scan page (immediately to the left of Policies on the navigation bar) and you should come to the following screen:
As we did for creating a policy, we need to add a scan profile here. Unlike policies, scans can be set up for one-time, immediate use so let’s use that option as we go through the process. Begin by using the Add button (I honestly wish there was a scan now choice, but such is life, eh?) You should see the following:
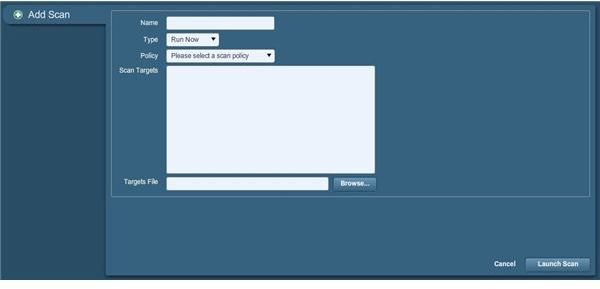
Now we need to provide the information on what internet location to scan. You could input an IP address; however it’s much better to provide the location in URL (domain name) format. For the purposes of this guide I will use an address for a blog archive used with my primary URL, which due to constraints involving my website being hosted with Google’s Blogger service (as I have not tested a subdomain configured to such a hosted domain using an external hosting provider by enough measures to configure the archive by other means) I will be using a double subdomain registered to a free website hosting provider (structured in the format of addedsub.mainsub.hostingprovider.com). The actual URL is listed in the pictured example within a multi-line URL specifications box (the fourth option from the top); in other words, we can specify more than one URL with each address provided line by line.
Continued: finishing scan preparations and beginning the scan process
Running and Monitoring the Scan
Of course, we’re only using one line in this example, so additional URL inputs aren’t necessary for the purpose of this guide, but rest assured that you really do have such an option in case you actually need it. Above the URL targets box, you should notice a policy selector drop-down; select the bhtest policy we created earlier for the scan processing that will be done shortly. Finally, in the very top box type a reference name for your scan to view the results at a later time from the reports page. The bhtest name was used again for the reference name for our example scan (yes, Nessus really does permit the same reference name to be used for both policy profiles and scan reference names) but we can skip the targets file in this case as we already specified our scan target (you will really only need to use one or the other, and a standard ASCII text file is required – no Unicode is permitted, unfortunately). We’re now ready to proceed, so click Launch Scan and the progress will be displayed as follows:
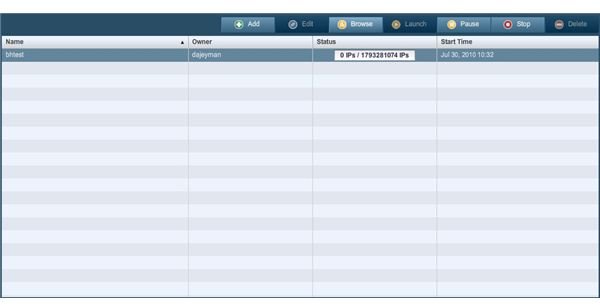
You can hit the browse toggle at any time to view the progress of a scan by URL, as follows:
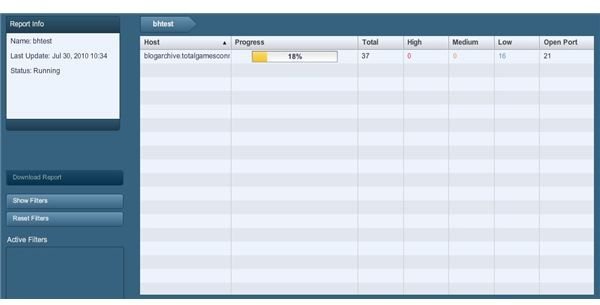
Each URL will have a full yellow bar with Complete in the middle after being scanned, with progress percentage displayed until then). You can also view the results to date per URL, in addition to the final results for that URL by clicking the applicable host URL which brings up the following:
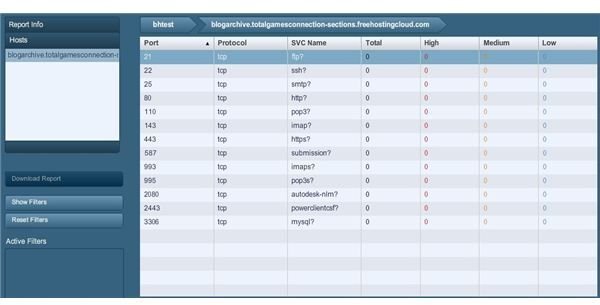
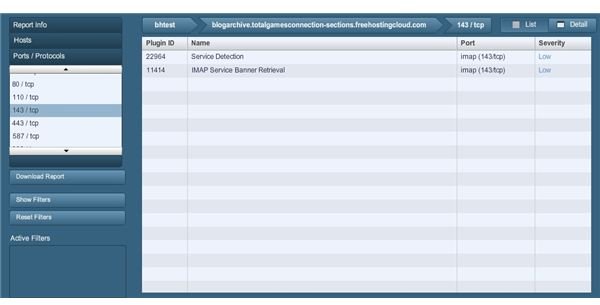
And you can further navigate by clicking the results for a specific TCP port by clicking it in the list for its detailed results as in the following example:
One last note or three: if at any time you want to refer to your scan results you can do so from the reports screen. Navigation of the reports themselves need only require you to click the breadcrumb toggles above the results list, or simply use the category selector on the upper portion of the far-left area to move between report information, scanned hosts and port scan results and choose any relevant options from there.
And that’s a wrap! If you found this useful, then be sure to check any of the other how-to guides available right here on the Hub. Until next time…


