Ever wonder what a spectrum is? How about a spectrograph? Read on to find answers to what a spectrum is, what causes spectra, and just what is a spectrograph. Also, how scientists use them to study stars, and many other objects in the cosmos, and learn about their composition.
What is Spectrum, Spectra and Spectrograph
A spectrum is the most important tools an astronomer uses. In a spectrum, the components of radiation are arranged progressively in terms of wavelength or frequency. The spectrum of each celestial object contains information on the chemical composition of that object. A rainbow is the most spectacular natural spectrum we can see everywhere. It occurs when sunlight falls on a raindrop and is refracted, splitting the white light into its composite colors. A group of spectrums is called a spectra.
A spectrograph is the device used to make the spectrum of a radiation source. Here, the radiation is dispersed into individual components by passing it through a prism or a diffraction grating. The light from celestial objects are collected by means of a telescope and it is then directed to prism or grating. In a modern spectrograph, a collimator is fitted in the telescope so as to straighten the converging beam and then direct it to a grating. The spectrum produced is then recorded digitally using a charge couple device or CCD, or in the past, on photographic film.
Different Types of Spectra
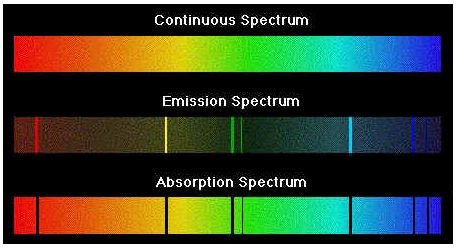
There are three kinds of spectra, namely: continuous, emission and absorption spectrums, the latter two are also referred to as line spectrums.
-
A continuous spectrum is formed by an object, which is solid or liquid in nature and heated to the point of incandescence. There are no lines in a continuous spectrum.
Advertisement -
An emission spectrum is formed when a gas is heated to the point of incandescence. An emission spectrum contains bright lines against a dark background. In an emission spectrum the lines appear brighter as energy is absorbed and subsequently emitted by the gas molecules.
-
An absorption spectrum occurs when the light produced by an object, which is in a solid, liquid or gaseous state, passes through a gaseous medium that is not in a state of incandescence. Such a spectrum contains dark lines. Here the wavelength of radiation corresponding to the gas molecules in that medium is absorbed. These missing wavelengths appear as dark lines in the spectrum.
Advertisement
This division of spectra into three classes was done by Gustav Kirchhoff in 1850s. Thus, by studying the spectrum produced by each heavenly body it is possible to identify the composition of that object.
Astronomical Applications Of Spectra
A star has a photosphere, which is the source of radiation we see. The continuous spectrum produced by this photosphere then passes through a medium, which is comparatively cooler than the photosphere. Since it contains gas molecules, radiation of certain wavelengths are absorbed and an absorption spectrum with dark lines is obtained. By closely studying the missing lines scientists are able to identify the elements present in the medium.
The continuous spectrum emitted by a star contains all wavelengths, but the intensity of radiation for each wavelength is different and each star has a wavelength, or band of wavelengths that it radiates more intensely**,** thus, the color of a star corresponds to that wavelength at which the intensity is highest. This relationship between wavelength and color also sheds light on to the temperature of the star . Using this relation, scientists have arranged stars into seven classes denoted by O, B, A, F, G, K and M .
Stars belonging to O group have the highest temperature and are very blue in color, whereas M type have the lowest temperature and are red in color. Thus, in accordance with Wien’s displacement law, the star with the longest wavelength has the lowest temperature and vice versa. From the study of spectra it has been established that the Sun is a G star. In addition to this, the spectrum gives information on the mass, density of each element, intensity of the magnetic field, and changes occurring in a star. Finally, it helps scientists to study the materials, which fill the rest of the universe.
Redshift and Blueshift
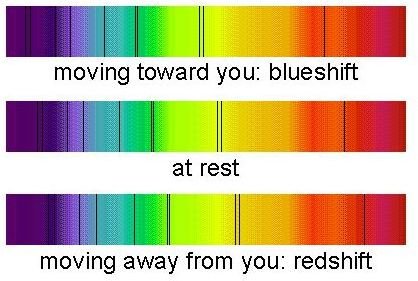
A spectrum also helps to prove the dynamic nature of universe. As seen earlier, each celestial object has its own characteristic spectrum. The spectral lines corresponding to an elements present in a galaxy can be identified by comparing it with the actual spectral lines recorded for each element on Earth. If the spectral lines observed from a galaxy shows a shift towards the red colour then it is called redshift.
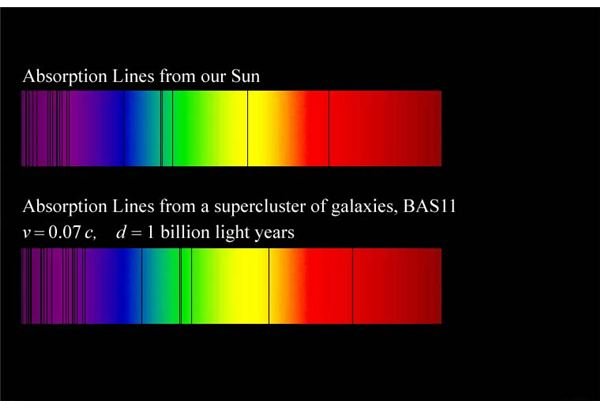
Whereas, if the shift is towards blue, then it is a blueshift. According to Doppler Effect, if a source is moving away from an observer then there is an apparent increase in wavelength of the light emitted by that source, this results in a redshift in its spectrum. Likewise, in a blueshift the source is moving towards the observer, hence a shift towards shorter wavelengths. Spectral lines obtained from most of the galaxies show a red shift, whereas the number of galaxies which show a blue shift in its spectral lines are only few, Andromeda is one among them. Thus, this shift in spectral lines provides information on the movement of galaxies. Since most of the galaxies are showing shift towards red it is commonly pointed out that the universe is expanding.
Searching For Exoplanets:
Another use of a spectrum is detection of exoplanets. Exoplanets are planets outside our Solar System**,** but like our Solar System they too orbit round a star which may or may not be similar to the Sun. It is very difficult to identify them using conventional methods since they are at a very large distances from us and the radiation reflected from these planets is very faint. It is difficult to distinguish the light reflected from these planets from that of the star around which they are revolving. The spectrum of the scattered radiation from planets is Doppler shifted and it is possible to distinguish the spectrum of a exoplanet from that of the central star. This is then studied to find the chemical composition, temperature and other properties like the presence of an atmosphere. It is also possible to detect the presence of a planet around a star as it tugs on the star causing its spectrum to shift toward the red end, as the planet pulls the star away from us, and when the planet is between us and the star it causes the star’s spectrum to shift toward the blue end.
Sources
imagine.gsfc.nasa.gov/docs/science/how_l1/spectra.html
https://stars.astro.illinois.edu/sow/sowlist.html
“blue shift.” The Columbia Encyclopedia, Sixth Edition. 2008. Encyclopedia.com. 12 Sep. 2009 https://www.encyclopedia.com .
https://star.herts.ac.uk/progs/dwarfs.html
Picture sources:
Spectra Image: https://ircamera.as.arizona.edu/astr _250/Lectures/Lec08_sml.htm
Sun and Super Cluster Image: https://www.ccp14.ac.uk/ccp/web-mirrors/isotropy/~stokesh/redshift.jpg
Redshift, Blueshift Image: https://cosmology.net/images/redshift111.jpg