Problem: Your manager needs you to graphically document the steps in a project plan, as shown in Fig. 1428.
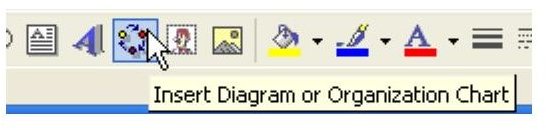
Strategy: Excel offers five fairly sophisticated tools for creating certain types of business diagrams. All five types are accessed from either the Insert – Diagram option on the menu or from this icon on the Drawing toolbar, as shown in Fig. 1429.
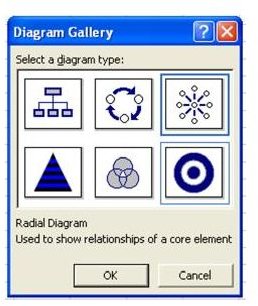
Ignoring the OrgChart option for now, the other five types are all somewhat interchangeable. As shown in Fig. 1430, these are the diagram types available: Cycle, Radial, Pyramid, Venn, and Target.
Each type of diagram offers a handful of predefined formats. After you have the data input, you can easily switch from one format to another, or from one diagram type to another.
Choose a Cycle Diagram and hit OK. The Cycle Diagram is the middle choice in the top row. It is used to show a process with a continuous cycle.
A default diagram draws with three steps. Each step says “Click to Add Text”. Click in the first text box and type “Identify Opportunities for Improvement”, as shown in Fig. 1431.
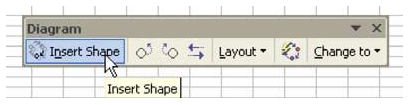
The next step is “Identify Root Causes”. The third step is “Identify Possible Solutions”. At this point, you need to add a fourth and a fifth step. As shown in Fig. 1432, in the Diagram toolbar, choose Insert Shape to add a fourth step. Choose this button a second time to add a fifth option.
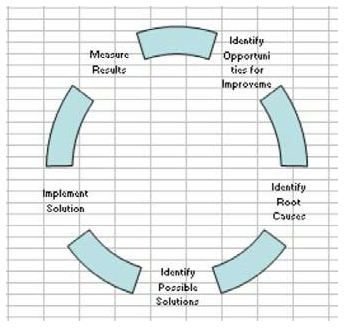
Type the text for the fourth and fifth steps. You will have a basic default diagram, as shown in Fig. 1433.
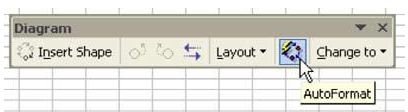
As shown in Fig. 1434, choose the AutoFormat button in the Diagram toolbar.
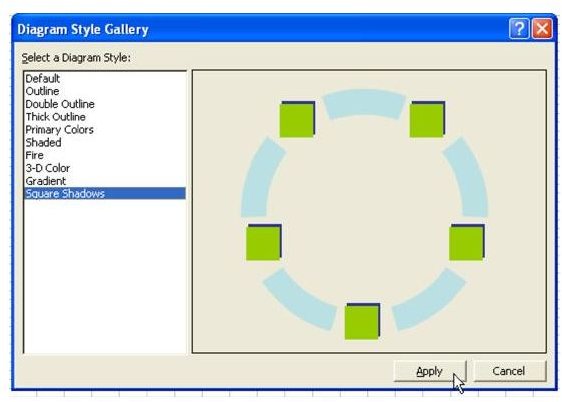
You will have ten options to choose from, as shown in Fig. 1435.
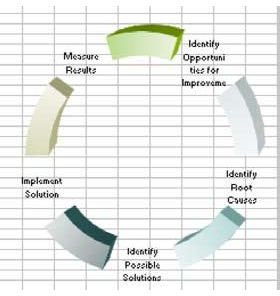
As shown in Fig. 1436, the 3-D Color option is pretty cool.
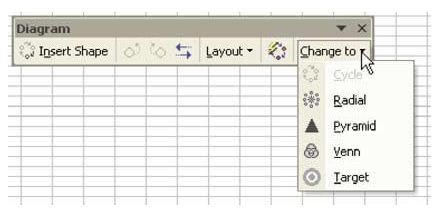
After you have a diagram set up, you can see how this data would look in another diagram type. As shown in Fig. 1437, from the Diagram toolbar, select the Change To dropdown to change between the five types.
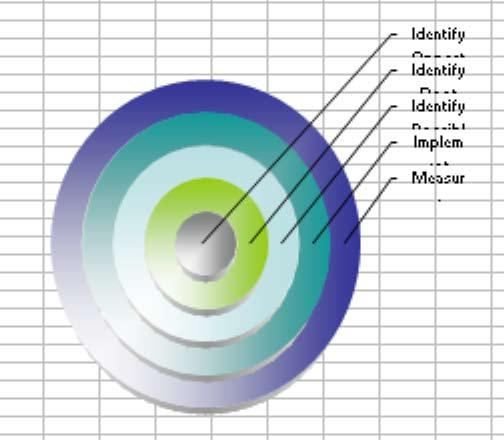
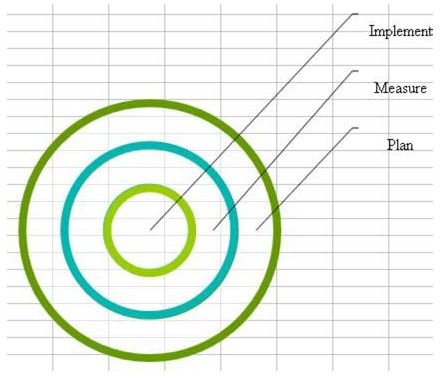
As shown in Fig. 1438, here is the same data on a Target chart.
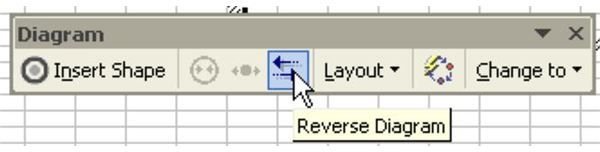
In a Target chart, the innermost circle is supposed to be the final step in the process. In this case, you need to reverse the order of the rings. Use the Reverse Diagram button on the Diagram toolbar, as shown in Fig. 1439.
As shown in Fig. 1440, here is the same data on a Venn diagram.
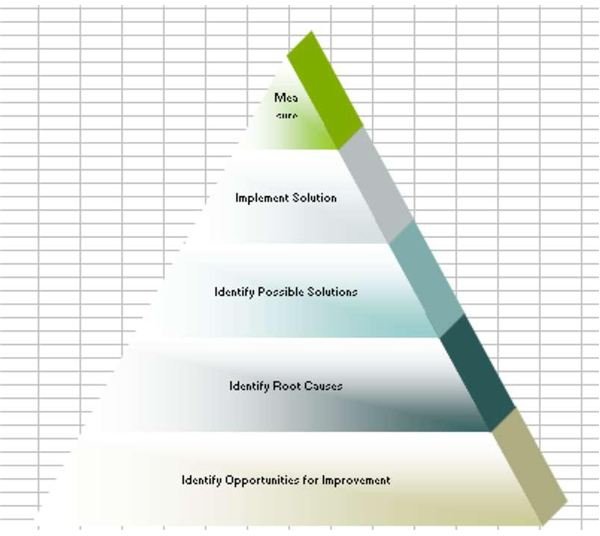
Here is a Pyramid diagram, as shown in Fig. 1441.
And, finally, a Radial diagram, as shown in Fig. 1442.
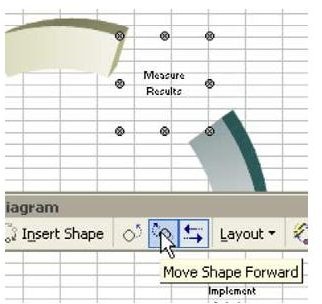
While you are creating the diagrams, the Diagram toolbar will offer a variety of tools for rearranging the sequence of tasks. As with a chart, the first click selects all of the elements in the diagram. The second single click accesses an individual element of the diagram. Two single clicks were used to select this one step of the diagram. You can now use the Move Shape Forward or Move Shape Backward icons on the toolbar, as shown in Fig. 1443.
Gotcha: Excel will frequently truncate longer text entries in business diagrams. You will have to adjust the font sizes or shorten your words.
Summary: The five business diagrams on the Drawing toolbar are all interchangeable with each other. They each offer ten unique AutoFormats, making for the possibility of 50 different looking diagrams.
Commands Discussed: Insert – Diagram
Images