Comparative and common-size financial statements work together to present a more complete analysis of a company’s performance. But, how do they differ and what types of information can you learn from each one?
What’s the Difference?
A comparative presentation of financial reports shows the results of business operations for two or three years in succession. GAAP rules on the manner of comparative financial reporting are less rigid since the pronouncement related to its implementation is merely an expression of its desirability as a presentation method. Income statements may make use of three annual data and at least two years for balance sheet. Under the IFRS system, comparative reporting for at least one year is required.
Since the common size financial statement has been explained in a separate article entitled Analysis of Common Size Financial Statements , much of our focus here is in describing the comparative financial report. In the said article, we included examples of the comparative income statement and balance sheet to fully illustrate the methods of transforming them into common size financial reports. The same financial reports will be our basis for explaining Comparative and Common Size Financial Statements, in order to arrive at the conclusion that both presentations are significant. (As you come to each image, please click on it to have a larger view of our illustrations).
We will assume the role of a financial statement (FS) user, to effectively realize the importance of common size financial statements in our analysis
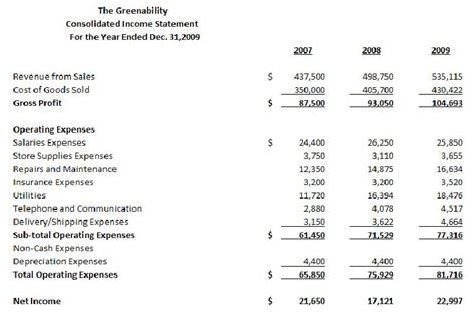
Analyzing the Comparative Income Statement
When comparing the financial data using this type of presentation, FS users refer to the differences in dollar values as the “absolute changes." The earliest year is chosen as the arbitrary index, the point from which growth or diminution trends will be based. A quick examination of our sample Comparative Income Statement will immediately create an impression that the company is enjoying a positive trend in its operations. It can be gleaned that Revenue from Sales is on an upward trend for the past three years.
As FS readers, we may initially skim through the statement and immediately proceed to the bottom-line figure, which is the net income. This way, we can have an idea by how much the company’s earnings have increased. Although the figures presented are still positive, the reader will notice that something is out of line or out of proportion. This now calls for a closer look at the financial data, and the following are the points to be considered in our analysis:
(1) If the net income for 2007 is $21,650, it follows that the net income for 2008 should be higher than this figure, which is quite contrary because the net income for 2008 plunged to $17,121.
(2) By the year 2009, the net income elevated to $22,997, which is only around a thousand dollar increase after two years of operations. Definitely, this figure is way out of proportion if you will compare the increase in Revenue from Sales between 2007 of $437,500 vs. 2009 of $535,115.
(3) The FS reader will find it necessary to re-examine the other components of the income statement to determine where the possible causes of disproportion are rooted. Cost of Goods Sold (COGS) makes a similar upward trend, which is natural since Revenue from Sales also increased.
(4) However, if the increase in COGS is compared to increase in Sales, it is noted that the difference in Sales between 2007 and 2008 represents an increase in revenue by $61,250. This was the additional money that came in for the year. If compared to the difference in COGS between 2007 and 2008 of $55,000, this was the increase in money spent for the year. This comparison immediately presents a distortion in cash movement, because the increases show that there is a very narrow leeway between additional money that came in vs. additional money spent–an indication that the increase in COGS is related to a corresponding increment in Purchase Price and not at all attributable to the entity’s selling activity.
(5) It follows that the business in 2008 was working on a very narrow gross profit margin, although the trend in 2009 showed improvement as the amount of Revenue from Sales continued to increase. However, it is still not impressive, because it seems that the rate of increase in 2009 decelerated if compared to the rate of increase noted between 2007 vs.2008.
At this point, the FS reader will now be interested in knowing exactly the percentages that these increases and decreases represent. In having a Common Size Income Statement available, the differences in dollar figures are best analyzed if the FS reports show proportions expressed in rates and percentages.
Supporting the FS Analysis Using the Common Size Income Statement
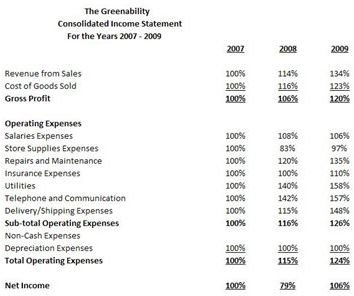
Our sample Common Size Income Statement will show points of consideration from 1 to 5 in percentages, and at a glance the proportions of every increment and diminution are immediately perceivable. We will now use the Common Size Income Statement to analyze our points of consideration numbers 1 to 5.
(1) Net Income figures, although positive throughout the 3-year consolidation, show that the net income generated in 2008 went down by 21% compared to 2007.
(2) The 2009 Net Income increased by a mere 6% when compared to 2007. The trend shows that there is still a lot of improvement needed since the rate of increase is quite slow.
(3) The increment in COGS in 2008 is 16%, which is higher than the increment in Revenue from Sales of 14% for the same year.
(4) The disproportion can be immediately pinpointed as the narrow margin between price markup, which is the basis of the amount of money that came in, as against purchase price of the cost of goods sold being the basis for the money spent.
(5) Gross Profit in 2008 was quite narrow at a 6% increase. The 2009 20% increase in Gross Profit may be considered as an improvement; but after considering the Operating Expenses, it shows that a corresponding rise in expenditures posted a higher increase of 24%. Again, the proportion of the additional money that came in was affected by the additional cost to sustain the business.
Summary:
Our brief analysis of the Comparative Income Statement and Common Size Income Statement, from the examples we used in explaining the comparative and common size financial statements, clearly defines the significance of each method as a tool for financial analysis. Where the comparative provides the dollar value of the results of the business, the common size presents the performance trend and the aspects that need to show improvement.
Note: It may interest the reader to read the complete analysis of our sample comparative financial statement in the article Analysis of Common Size Financial Statements, to know how the income generation performance affected the balance sheet accounts __.
Reference Materials and Images Credit Section
Reference Material:
- From Purdue University, College of Consumer and Family Sciences, at https://www.cfs.purdue.edu/class/htm241/notes241 _ch3.pdf
Images Credit:
- Author cscantoria’s files


