In the financial accounting world, depending upon the size of your business, you may wonder, what are operating reports and charts of accounts and are they different or the same? While they both connect, they can serve a different purpose, especially when it comes to report options.
Charts of Accounts Vs. Operating Reports
To best understand the question what are operating reports and charts of accounts, it’s best to understand each of them in detail.
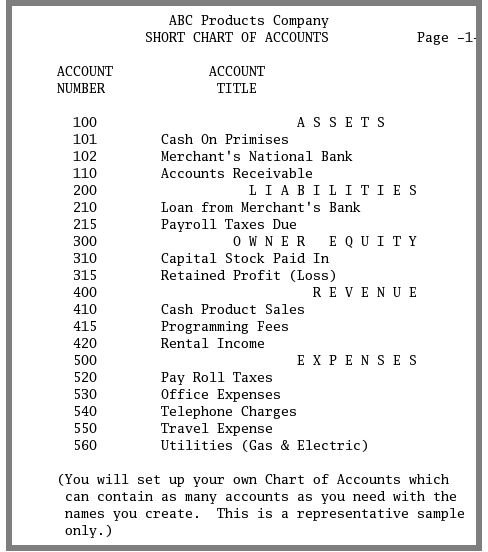
Chart of Accounts – This is a list of all the accounts your business uses to track financial transactions. Within your accounting software, you probably have an option to run a report that will reveal every account by number and name. For example, a chart of account report may look like this:
ABC Company - Chart of Accounts
- 101 – Cash in Bank
- 102 – Accounts Receivable
- 103 – Notes Receivable
- 107 – Inventory
- 110 – Prepaid Expenses
- 117 – Furniture & Fixtures
- 118 – Land & Buildings
- 202 – Accounts Payable
- 203 – Sales Tax Payable
- 204 – Accrued Payroll
- 207 – Notes Payable
- 211 – Common Stock
- 212 – Officer Accounts
Note that when you run a chart of accounts report, it does not show any financial transaction information, only a list of every account you utilize within your business. Charts of accounts are usually set up during the start-up of your business and often gaps in numbers used are present in the event new accounts must be added.
Operating Reports – Think of your operating reports as a list of your chart of accounts that shows the transactions within each account. Most operating reports can be run as a summary report or a detailed report. Here’s a look at what a summary operating report would look like:
ABC Company – General Ledger Summary Report
- 101 – Cash in Bank - $10,000
- 102 – Accounts Receivable - $5,000
- 103 – Notes Receivable - $15,000
- 107 – Inventory - $50,000
- 110 – Prepaid Expenses - $3,000
- 117 – Furniture & Fixtures - $25,000
- 118 – Land & Buildings - $100,000
- 202 – Accounts Payable - $25,000
- 203 – Sales Tax Payable - $2,000
- 204 – Accrued Payroll - $4,000
- 207 – Notes Payable - $50,000
- 211 – Common Stock - $200,000
- 212 – Officer Accounts - $100,000
As you can see, this operating report for a general ledger summary shows the account number, the name of the account, and the amount that is in the account at the time the report is run.
Both a chart of accounts and summary operating reports can be beneficial in two ways:
- Chart of Accounts – This is often printed to keep on hand so the bookkeeper or accounting professional has access to a list of all your accounts to determine where transactions should be posted in the general ledger or journal.
- Summary Operating Reports – This is usually utilized as a summary or snapshot of what is in each account at the end of a reporting period. It does not show the detail of where these summary totals came from, however.
Image Credit: ABC Chart of Accounts (https://webpages.charter.net/linuxledgers/images/scrnshts/shortcoa.png)
Detailed Operating Reports
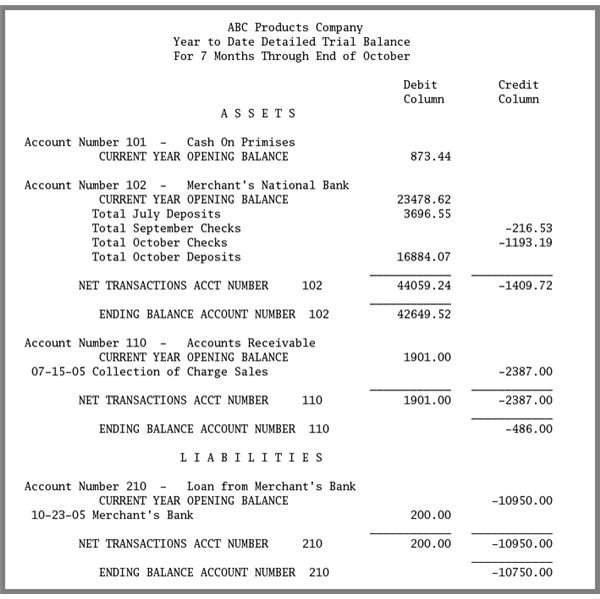
Now that you know the difference between what are charts of accounts and operating reports, it’s time to delve into the world of detailed operating reports. These reports, depending on which report is run, will show not only the account number and name, but also show a beginning balance, any increase or decrease for the accounting period (usually a month), and an ending balance. A detailed general ledger may look like this:
ABC Company – General Ledger Detail Report
Acct # / Name / Beginning Balance / Change / Ending Balance
- 101 / Cash in Bank / $5,000 / $5,000 / $10,000
- 102 / Accounts Receivable / $10,000 / -$5,000 / $5,000
- 103 / Notes Receivable $20,000 / $-5,000 / $15,000
- 107 / Inventory / $75,000 / -$25,000 / $50,000
- 110 / Prepaid Expenses / $3,000 / $0 / $3,000
- 117 / Furniture & Fixtures / $26,000 / $1,000 / $25,000
- 118 / Land & Buildings / $100,000 / $0 / $100,000
- 202 / Accounts Payable / $30,000 / -$5,000 / $25,000
- 203 / Sales Tax Payable / $1,000 / $1,000 / $2,000
- 204 / Accrued Payroll / $2,000 / $2,000 / 4,000
- 207 / Notes Payable / $55,000 / -$5,000 / $50,000
- 211 / Common Stock / $200,000 / $0 / $200,000
- 212 / Officer Accounts / $110,000 / -$10,000 / $100,000
Notice in this operating summary of the detailed general ledger some accounts have no change in the accounting period where others do. The changes are the result of journal entries posted into the correct account using the chart of accounts.
Detailed operating reports can dig even deeper than this, however. By looking at the example above, you can see the plus or minus change in the accounts and the ending balance–but what makes up those changes?
Image Credit: ABC Trial Balance (https://webpages.charter.net/linuxledgers/images/scrnshts/dtltrbal.png)
Drilling Down
Most accounting software programs have the ability to do what is called drilling down. This is done by looking at each account within the chart of accounts to find the actual posted transactions to determine where the ending balance came from. When working with drill down accounts, usually only one account is reviewed at a time. For example, a drill down operating report might look like this:
ABC Company – Chart of Accounts Drill Down
If we take the account cash in bank from the detailed operating report, it shows a beginning balance, change, and ending balance, but what comprises those numbers? This is where the drill down operation comes in:
Acct # / Name / Beginning Balance / Change / Ending Balance
101 / Cash in Bank / $5,000 / $5,000 / $10,000
If a drill down is performed to explore the cash in bank:
- 101 / Cash in Bank / Beginning Balance / $5,000 / Ending Balance
- 7/2 / Check 200 to Smith Supply / -$1,000 / $4,000
- 7/2 / Deposit to Bank Cash Sales / $1,000 / $5,000
- 7/5 / Deposit to Bank A/R / $5,000 / $10,000
- A/R from John Doe - $1,000
- A/R from J. Smith - $1,000
- A/R from J. Johnson - $3,000
As you can see, not only does a drill down report show each transaction that changes the beginning balance to get to the ending balance, accounts such as accounts receivable are drilled down even further showing who actually paid their amounts due so you can relieve their accounts of money owed. Accounts such as accounts receivable , inventory, and accounts payable are usually journal or scheduled accounts that allow the bookkeeper to post transactions to the individual or inventory item as needed.
Hand In Hand

As you can see, your chart of accounts is essential in determining what accounts are needed to operate your business. On the other side, operating reports work hand in hand with the chart of accounts to help bookkeepers and accounting professionals analyze the amounts within each account and also check for posting errors.
The next time you are asked what are charts of accounts and operating reports, you’ll have a better understanding of how they work together and individually in the financial accounting world.
Image Credit: Purple Hand (https://commons.wikimedia.org/wiki/File:Purple _hand.svg)


