Sales forecasting can be tricky and complicated, but not when you base it on sales trends seen over the past. Here’s how cyclical patterns identified in historic sales records can be used to anticipate future sales.
Getting a grip on the sales cycle is one of the best ways to understand market mechanics and forecast future sales trends. Most other forecasting techniques aren’t as easy to implement as sales forecasting using cyclical analysis. This method is also referred to as the exploration method, and is particularly useful when historic sales records show a rhythmic up and down pattern across the timeline.
Conducting the Cyclical Analysis
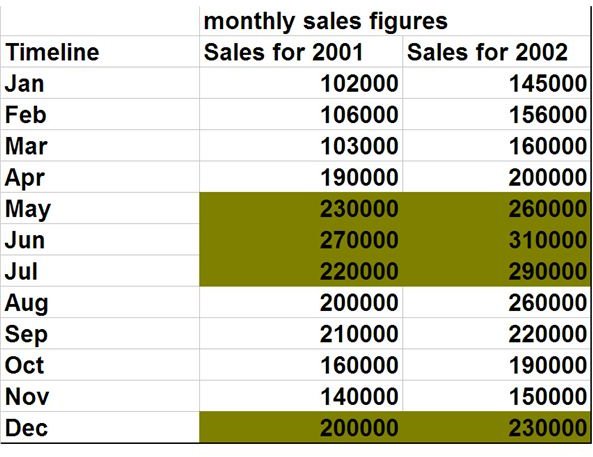
To get a better understanding of how cyclical analysis can be used to make sales forecasts, we’ll explain the procedure with the help of an example. Let’s assume there’s a firm which is a supplier of plastic parts for refrigerators, and its past sales records look something like what’s shown in the image below.
Although a first glance at the figures would tell you that a certain rise and fall pattern exists in the sales volumes, which is reflected in the sales data of both the years. Still, let’s make the swings more visually discernable by plotting this data in a graph. Here’s what the graph looks like.
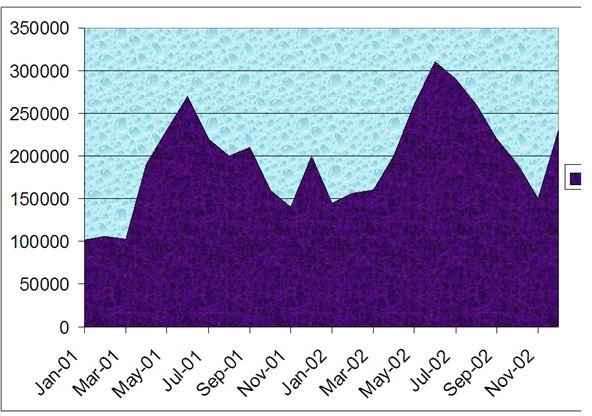
Now that we’re almost certain that a cyclic pattern exists in the past sales records of the business, we can go ahead and use this cyclical analysis to make sales forecasts. Here are some findings from the study of the above graph:
- Sales rise from March to June and then experience a decline until November. This seasonal rise and fall in the sales can be attributed to the increased purchase of refrigerators during the hot season and diminishing sales as winter approaches.
- Sales experience a mild increase in the month of December, perhaps due to people making holiday purchases.
- Overall sales for the year 2002 are somewhat more than the sales for 2001.
These three findings will be the guiding factors when we make a sales forecast for 2003.
The pattern indicates that the business must increase its inventory before the month of March begins and must trim it down post July. Also, something similar will need to be done to keep up with the rising sales during December. Not doing so and holding on to a fixed level of inventory all year through would tie up money in excessive inventory during the lean periods and make the company unable to supply higher quantities during peak periods. The first situation will have detrimental effects on your finances and the second can lead to your competitors taking over a piece of your market share.
Overall sales volumes have been growing over the years and to make a valid forecast, this rise should also be taken into account. So, here’s how to proceed with the forecast for 2003.
Making the Sales Forecast
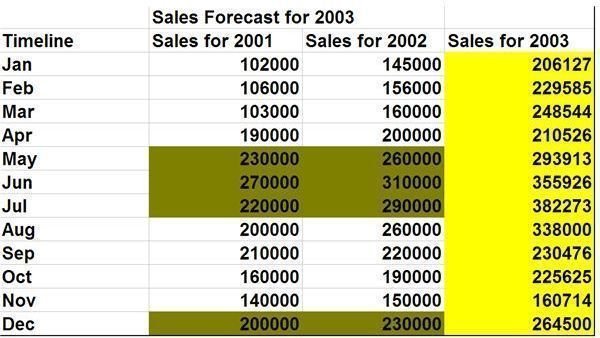
The first thing to be determined is by what percentage sales have grown from 2001 to 2002. For the month of January the rise is about 42%, so a plain and simple estimate for tentative sales during January 2003 can be made by increasing the sales figures for January 2002 by 42%. Using this simple method, the sales forecast can be made for each month of 2003, and here’s what the final forecast will look like.
The above example is a simple one and we have used data from the last two years only to make the forecast. However, for the forecast to be more accurate it is advisable to analyze data from at least the last five years. When using data from more than two years the percentage growth should be taken as the average of the percentage growth for all consecutive years.
Despite all the efforts you put in, a sales forecast based solely on cyclical analysis cannot be completely accurate since there are many more factors that influence sales that have not been taken into account.
What Could Cause your Forecast to be Inaccurate?
As we just mentioned, there are a multitude of factors that can make your sales forecast ineffective, let’s take a look at some of these factors.
Economic Factors: A rise in interest rates, economic slowdown and increased unemployment are some of the factors that can adversely affect sales. As the purchasing power of the end customer rises or falls, sales will experience something similar.
Environmental Factors: Some product lines experience changes in sales patterns based on some related environmental factor. For instance, if the period for which the forecast is being made experiences relatively less rainfall, the sales for rain related products, like umbrellas, rain shoes and rain coats, may remain below the past sales records.
Technological Innovations: Every day there is a new discovery, and if an alternative product with new appeal compared to your product has arrived in the market, it’s quite likely that some of your customers will shift over to the new innovation.
Competition: When new competitors jump into the market, your business will lose out on some of its market share. This is another factor that the method of sales forecasting using cyclical analysis doesn’t take into consideration.
Despite all its drawbacks, this method still remains one of the most used and most trusted methods for generating sales forecasts .
References & Credits:
Image Credit:
Image by – Sidharth Thakur


