If you believe you may be losing your job this article may provide the answers you need. We made an in-depth review of the current job loss statistics in order to furnish career-seeking readers with a comprehensive, guide.
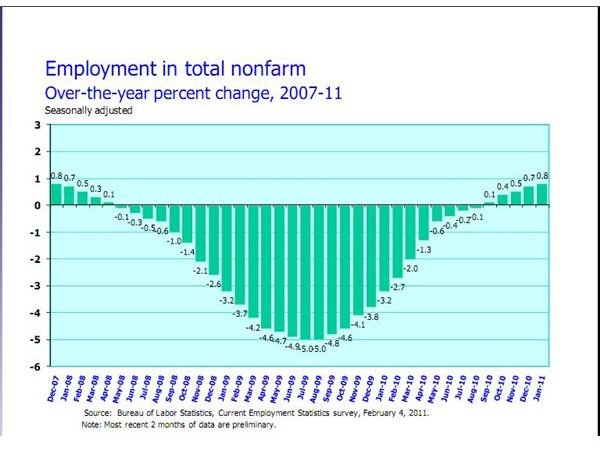
In taking a look at the latest employment survey reports released by the US Bureau of Labor Statistics (BLS), a quick glimpse of the survey graphs seem to reveal a semblance of positivity in employment trends. However, there is still much to be desired if we shift our focus and take a closer look at the trending job loss statistics.
As of December 2010, the employment graphs may have taken an upward trend, resulting in the abatement of unemployment rates from 9.9% in 2009 to 9.4% in 2010. This indicated that the increase in employment resulted in a 0.5% decrease in unemployment rate. This was further reduced to a 9.0% rate as of January 2011.
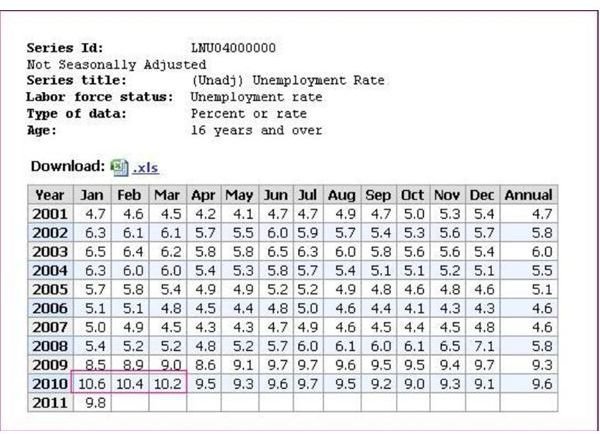
Still, if you focus on the unemployment rate instead, you will note that in the months of January, February and March of 2010, unemployment sunk to an all time low of 10.6%, 10.4% and 10.2% respectively. Take note that those were the highest rates of unemployment ever posted during the entire decade, from 2001 to 2010. (Kindly click the chart below to enlarge the image).
Considering that these tremendous job loss rates took place in 2010, the growth in hiring trends during the year-end could still be regarded as unstable.
Our objective in studying the trending of job loss statistics is not to douse any optimism regarding current occupational trends. The primary aim is to pinpoint the sectors where job applicants can hope to find the most job opportunities available and what they need to do to enhance their qualifications.
Since our main interest is in tracking down the industries where job loss is most prevalent, we delved into BLS’s latest survey program for Mass Layoff Statistics.
Image Source: Bureau of Labor Statistics, Current Employment Statistics Survey, Feb. 04 2011 and Current Population Survey
A Detailed Look at the Mass Layoffs in the Retail Trade Sector
In line with the current technique of analyzing business trends based on consumer behavior, we will take into consideration the retail trading sector. This sector is involved in the distribution and disposition of the manufacturers’ finished products, where the consumer as a direct participant decides on the fate of the goods being produced and sold. By identifying the retail sector that is most affected by consumer behavior, we can likewise discern how the workforce in the manufacturing sector was affected.
After all, the law of supply and demand will dictate that if the demand is low, manufacturers will find it necessary to lower their production or their selling prices.

Take at look at the graph for Employment in Retail from 2008 to 2011, and note the erratic demand for workforce in the retail sector. Inasmuch as this graph is tagged as seasonally adjusted, it denotes that adjustments have been made against the effects of changes in weather patterns.
Similar to the upward swing of employment last Dec. 2010 to January 2011, the same movement previously took place in December 2009 to January 2010. Coming from job losses of 19,200 in December 2009, the “over-the-month change” in January 2010 posted a recovery of 35,100 in terms of employment.
However, this immediately dropped to a mere 400 by February of the same year and continued to reflect fluctuations in the hiring trends from thereon through December 2010.
Hence, if we are to analyze the January 2011 improvement in retail trade hiring, the stability of employment in this sector is still dependent on consumer behavior.
Mass Layoff denotes that there are at least 50 employees who were separated from a single employer due to plant closings while an Extended Mass Layoff is a separation of at least 50 employees from a single employer for more than 31 days, usually as a result of seasonal patterns but could also lead to separations.
Image Source: Bureau of Labor Statistics, Current Employment Statistics Survey, Feb. 04 2011
The next page presents a trending of the job loss statistics of 2010 for the Retail Trade Industry.
Trending the Job Loss Statistics of 2010
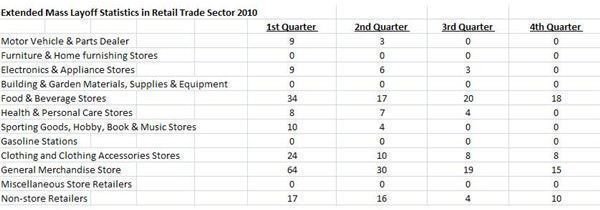
2010 First Quarter Extended Mass Layoff Events in the Retail Trade Sector
Below is a summary of Extended Mass Layoff , which identifies to which industry sub-sectors that the lowest levels of unemployment in January, February and March of 2010 are attributed. They are regarded as job loss statistics inasmuch as the seasonal layoff resulted in actual separations. This is likewise supported by claims of unemployment insurance filed by the displaced workers.
- General Merchandise/ Department Stores – 64 events; 23,545 separations
- Food & Beverage Stores – 34 events; 9,157 separations
- Clothing and Clothing Accessories Stores – 24 events; 3,791 separations
- Non-store Retailers – 17 events; 3,303 separations
- Sporting Goods, Hobby, Book & Music Stores – 10 events; 4,164 separations
- Motor Vehicle & Parts Dealer – 9 events; 933 separations
- Electronics & Appliance Stores – 9 events; 1,613 separations
- Health & Personal Care Stores – 8 events; 1,992 separations
2010 Second Quarter Extended Mass Layoff Events (MLE)
This identifies the areas for the job loss trend of May and June 2010, which could have been seasonal in nature but likewise resulted in actual separation of workers from employers. Notice that the Health and Personal Care Stores and Non-Store Retailers barely made any improvements.
- General Merchandise Store – 30 events; 10,471 separations
- Food & Beverage Stores – 17 events; 2,901 separations
- Non-store Retailers – 16 events; 2,333 separations
- Clothing and Clothing Accessories Stores – 10 events; 1,661 separations
- Motor Vehicle & Parts Dealer – 3 events; 164 separations
- Health & Personal Care Stores – 7 events; 1,024 separations
- Electronics & Appliance Stores – 6 events; 749 separations
- Sporting Goods, Hobby, Book & Music Stores – 4 events; 753 separations
2010 Third Quarter Extended Mass Layoff Events
By this period, the hiring trend in the Motor Vehicle & Parts Dealers and the Sporting Goods, Hobby, Book & Music Stores has shown improvement. Only six of the retail sections still showed layoffs that lasted for at least 31 days but resulted in actual separations .
Notice how the events and separations for Food & Beverage Stores increased, compared to the previous quarter. The Health & Personal Care Stores, on the other hand, had more separations during this quarter despite the low extended MLE that took place. This is indicative that there were more workers affected during the third quarter.
- Food & Beverage Stores – 20 events; 4,640 separations
- General Merchandise Store – 19 events, 7,829 separations
- Clothing and Clothing Accessories Stores – 8 events; 949 separations
- Health & Personal Care Stores – 4 events; 4,436 separations
- Non-store Retailers – 4 events; 1,791 separations
- Electronics & Appliance Stores – 3 events; 339 separations
2010 Fourth Quarter Extended Mass Layoff Events –
Only four sub-sections experienced extended mass layoffs during the last quarter of 2010**:**
- Food & Beverage Stores – 18 events; 3,319 separations
- General Merchandise Store – 15 events; 2,669 separations
- Non-store Retailers – 10 events; 3,722 separations
- Clothing and Clothing Accessories Stores – 8 events; 2,096 separations
However, the year-end also saw some mass layoffs aside from the the seasonal or extended MLEs.
Please proceed to the next page for details of the jobs loss statistics pertaining to the 2010 Mass Layoffs in the Retail Trade industry.
Mass Layoffs Due to Closure in the Retail Trade Sector in 2010
Prior to the culmination of the business cycle for the year 2010, all twelve sub-sectors in retail trading suffered from job losses as a result of mass layoffs related to the closing of an outlet or store.
Some employees of gasoline stations, furniture designers and dealers, building and garden supplies, materials and equipment sellers, as well as miscellaneous stores also suffered from loss of jobs despite the absence of extended mass layoff in their areas during the year. Except for building materials, the aforementioned sub-sectors were the least affected by the changes in consumer behavior and buying habits. Below is a summary fo the mass layoffs for the entire retail trade sector:
- General Merchandise Store – 104 events; 13,524 separations
- Food & Beverage Stores – 71 events; 5,994 separations
- Building & Garden Materials, Supplies & Equipment – 33 events; 3,154
- Clothing and Clothing Accessories Stores – 30 events; 1,818 separations
- Non-store Retailers – 20 events; 1,936 separations
- Health & Personal Care Stores – 15 events; 1,355 separations
- Gasoline Stations – 13 events; 894 separations
- Motor Vehicle & Parts Dealer – 9 events; 721 separations
- Electronics & Appliance Stores – 8 events; 510 separations
- Miscellaneous Store Retailers – 8 events ; 556 separations
- Sporting Goods, Hobby, Book & Music Stores – 7 events; 428 events
- Furniture & Home furnishing Stores – 4 events; 229 separations
Unemployment Rates per Industry in 2010:
The Bureau of Labor Statistics reported in its overall job loss statistics that the industry sector where the most number of displaced workers were recorded were those connected to construction businesses and those working in the food and beverage manufacturing industry.
Nevertheless, the addition of 161,000 various job positions in 2010 helped in alleviating the unemployment rate before the year ended.
Construction – 20.6%; this further went up in January 2011 to 22.5%. The number of unemployed reached 1,801,000 and has elevated to 1,879,000 in January 2011.
Related occupations in this industry are architects, civil engineers, cost estimators, engineering and natural science manager and landscape architects. Competition is keen and continuous learning and experience due to advances in types of building materials, construction methods and technology are important qualifications. In addition, there are also the laws being implemented as standards for safety, energy efficiency and environmental protection plus the potential detriments of litigations for non-compliance or non-delivery.
Agriculture, Forestry, Fishing and Hunting – 13.9%; this went up to 16% in January 2011.
Related occupations in this area are for farmers, ranchers, animal breeders, farming, fishing, forestry, logging and hunting workers, and supervisors.
Most jobs in this sector are performed by a workforce with relatively lower levels of educational attainment and are affected by the current practice of hiring seasonal migrant or H2A workers. However, farmers, ranch managers, corporate agricultural managers are constrained to seek higher levels of learning not only in the areas of agricultural technology and processes but also for the trading and marketing aspects.
In addition, new governmental regulations regarding food safety includes crops and livestock products raised and grown by farms and ranches, in order to bring back consumer confidence in the food industry. Global competition also requires the observance of proper food processes; hence the leaders of this sector have to meet global standards in order to compete in the international markets.
Kindly proceed to page 4 for more insights about factors that influenced job loss statistics and their effects on other business industries.
Unemployment Rates per Industry in 2010 (continuation)
Leisure and Hospitality – 12.2%
This industry includes arts, entertainment and recreation, food services and drinking venues, hotels and other entertainment forms and podiums. The industry is characteristically seasonal, which can likewise be dependent on consumers’ buying whims and financial capabilities. It can be noted that the retail trading sector disclosed large numbers of displaced workers engaged in the reselling of electronic devices and appliances, food and beverage, as well as sporting goods, hobby, books & music materials.
In addition, the majority of consumers have very little free time to engage in recreation and luxury; instead, they would rather spend whatever spare time they have on other income-earning opportunities or in some inexpensive form of relaxation.
Professional and Business Services – 10.8%
This workforce category includes the professional, scientific and technical service providers who perform specialized activities that require some degree of expertise and training. This includes legal services, accounting, tax preparation, bookkeeping and payroll services. Architectural, engineering and related services are likewise included in relation to conceptualization of specialized design and computer systems and designs.
Competency and professional expertise are largely required in these professions since they are relied upon to provide efficient and reliable support to the other business industries. Otherwise, companies resort to outsourcing the work to offshore BPOs (business processing organizations).
Mining, Quarrying and Gas Extraction – 10.8%; this went down to 8.5% in January 2011.
Similar to other industries, the hiring trends in the mining sector are significantly affected by advancements in technology. The use of sophisticated techniques as a means of increasing productivity and allowing more flexibility entails harnessing fewer manpower resources. The advent of lasers and robotically operated devices for drilling and extraction has replaced some of the manual work performed by traditional mining workers. All these resulted not only in increased efficiency but also fewer accidents and casualties.
Manufacturing – 10.6%
The manufacturing industry is broad and wide ranging and includes aerospace and defense, chemicals, computer and electronic products, food and beverage, machinery, motor vehicle parts, pharmaceutical, steel, textile and apparels. They are categorized either as durable or non-durable goods. Of these products, the aerospace and defense sector has dominated the manufacturing scene but the competencies required from the workforce are highly specialized.
Hiring in the food and beverage sector has suffered greatly due to the changing behavior in consumers’ buying habits and attitudes. The buying public has generally matured since most buyers are now conscious about food values, maximization of buying power, and wariness against cancer-causing additives as well as genetically modified products. In addition, a large number of consumers are making use of discount coupons; hence, buying choices have been directed to products that offer some form of return for their patronage.
Packaging has likewise affected consumers’ attitude toward products since local authorities have imposed stricter rules in garbage disposal as part of the government’s initiative to solve the mounting problems of waste management.
Please proceed to the next page for more information about job loss statistics in five other industries.
Unemployment Rates per Industry in 2010 (continuation)
Information – 9.7%; this went down to 7.3% in January 2011
Jobs abound in the broadcasting, motion picture and video industries, software publishers and telecommunications. However, greater competencies are required not only in conceptualizing materials but also in analyzing which has the likeliest capability to attract the discriminating taste of the public.
Wholesale and Retail Industry – 9.5%
These are as presented in the trending of job loss statistics in this article’s earlier pages.
Transportation and Utilities Industry – 8.4%
This industry is likewise affected by the effects of consumer behaviors and buying attitudes, since most of the workers are truck drivers who facilitate the movement of goods, from raw materials to finished products. The airline industry, on the other hand, has to contend with additional factors beyond its control, like unexpected weather disturbances.
Financial Activities – 6.9% this went up to 7.2% in January 2011.
Banking, insurance and securities investments are getting less attention due to the advent of publicly traded companies who betray investors‘ trust. Insurance companies, on the other hand, are currently undergoing reforms. Hence, companies are currently redesigning and redirecting their products for purposes of health care services. In fact, the large insurance companies are now into hiring their own professional health care workers, in order to control the actual medical costs.
Educational and Health Services – 5.8%
This industry is the least affected since the federal government has been providing financial aid and scholarship funding. Such conditions allow more students to enroll in all educational levels. The present administration aims to educate every child, in order to increase the population’s competencies for future employments. Thus the academic industry’s demands for teachers, instructors, trainers and teacher-aides have the most positive outlooks.
The job loss statistics provided in this article are for informational purposes, which could serve as a guide to career seekers regarding the current job hiring situations in every industry. Readers who would be interested in viewing the Bureau of Labor Statistics employment and unemployment trends i.e., according to gender, race, state, age, etc. can find more information by referring to BLS’s Data Retrieval: Labor Force Statistics (CPS ).
References and Image Credits:
References:
- US Bureau of Labor Statistics: Career Guide to Industries (CGI), 2010-11 Edition– https://www.bls.gov/oco/cg/
Image Credits:


