The Relative Strength Index is a stock evaluation tool that under some circumstances can indicate that a stock is undervalued or overvalued. Though not a perfect indicator, it has been used for 30 years to help traders make buy and sell decisions.
Introduction
RSI stands for Relative Strength Index and is a mathematical measure that can indicate whether a particular stock is being undervalued or overvalued. It does this by comparing, over a set number of trading periods, the times when the stock closed higher to the times when the stock closed lower. It is important to note that the Relative Strength Index is not the same thing as the concept of “relative strength.” Most relative strength calculations are comparisons between a stock and an index . In other words, “relative strength” determines how a particular stock is doing in comparison with a stock index - say the S&P 500.
The Mathematical Formula
The mathematical formula for RSI is as follows: RSI = 100 – [100/(1 +RSn)].
In this equation, RSn represents an average of a number of periods closing higher versus a number of periods closing lower.
The letter “n” simply stands for the number of days (or weeks if you are in a weekly graph) used in the calculation. The man who originally came up with the formula, economist J. Welles Wilder, suggested 14 days as an optimal value of “n.” If you do want to select 14 days as n, this means that to calculate the RSI, you would first find closing data for 14 days of trading, say, June 1 to June 14.
Example Calculation
You would add up the gains during those 14 days, say 14.3 cents one day, 9.6 cents the next, adding up to a total gain of, say, $1.40 over the 14 days. You would divide this by 14 to get a daily average gain of 1.40/14 = $0.10 per day. Next, add up the losses over the same 14 day period. Say it lost 12 cents one day, then lost 3.4 cents another day, and so on until the total losses for the 14 day time period added up to $2.80. Divide this by 14 to get the average daily loss of $0.20. To calculate RS, divide average higher close, $0.10 by the average lower close, $0.20 to get 0.50.
To determine the denominator of the second term on the right hand side of the equation, add 1 to RS: 1 + 0.50 = 1.50. Finish calculating the second term by dividing 100 by 1.50. The answer is 66.67.
To finally determine the value of the RSI, subtract 66.67 from 100 to get RSI = 33.33
The Usage
The RSI will always go from 0 to 100. The higher the RSI, particularly if it hits 70 or above, the more likely a stock is to be overvalued. If you have that stock with an RSI near 70, it may be a good time to sell. On the other hand, the lower the RSI - particularly as it approaches 30, the more likely a stock is to be undervalued. If you are following a stock and the RSI drops to 30 or lower, it may be a good time to buy that stock.
For instance, in the example above, where the RSI was calculated at 33.33, the stock was more likely to be undervalued, though other factors would still play a role. It is important that a trader not put all his or her faith in the RSI. The RSI works best when a stock price is volatile. When the market is “trending” one way or the other, the RSI can continue to go up well beyond 70 or go down well below 30 for several trading periods afterward.
Of course, nowdays the RSI is calculated automatically by most stock charting programs, making it easier to observe stock price fluctuations and the respecitve RSI.
Summary
While the general wisdom is that the RSI of an overvalued stock is 70 or greater and the RSI of an undervalued stock is 30 or less, the novice trader may want to use a broader range, like 80 and 20 to avoid acting prematurely. Also, overvalued and undervalued stocks can remain in an extended trend for a long time. Just because an RSI hits 30 or 70 doesn’t mean it is about to turn the other way. With RSI values, it is a good idea to watch the volumes traded when the RSI “sticks” around 30 or 70 for a while. That will help determine whether traders are starting to nail down profits or whether interest in buying a low RSI stock appears to be increasing.
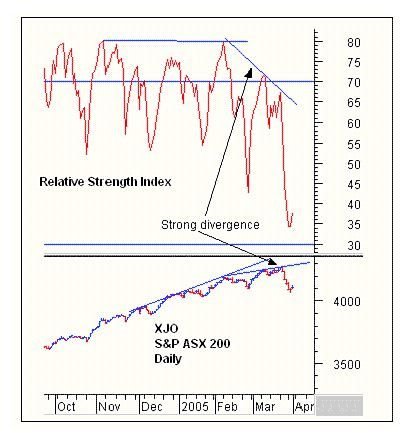
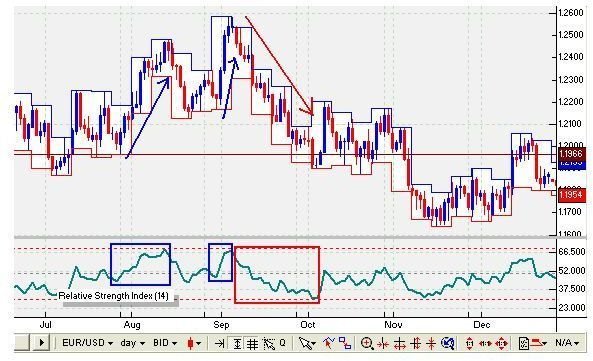
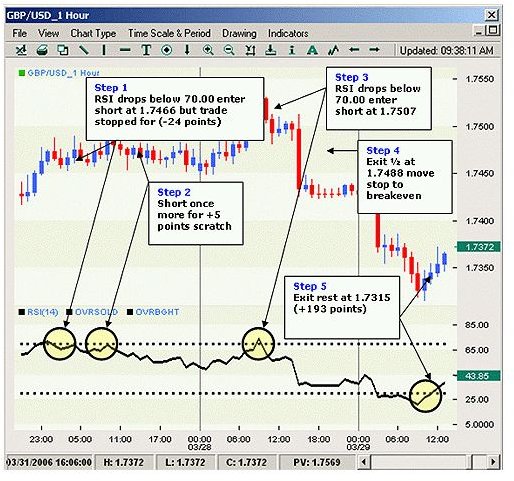
Relative Strength Index Graphing Examples