Averages are part of everyday life, from the time we are grade school students all the way into our adulthood. But most of us never get to know about the different variations, where they are used, and how they can work for you.
Simple Moving Average
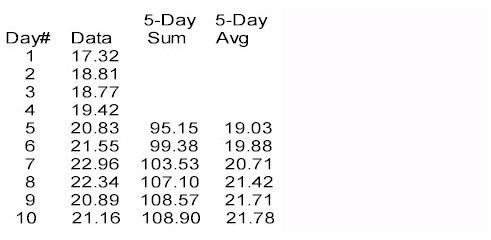
As the name implies, the simple moving average, or just moving average, is the most straightforward version. If you have a series of data values, such as the daily closing prices for a given stock or market index, you can compute the mathematical average of any number of these values. For our example, let’s use a five-day interval. Consider these values for the most recent ten days’ closing prices, starting with the most recent closing price:
We start by computing the average of the first 5 values (Day 1 through Day 5):
Avg(Day5) = (17.32 + 18.81 + 18.77 + 19.42 + 20.83) / 5 = 95.15 / 5 = 19.03
We next compute the average for the next 5 values (Day 2 through Day 6):
Avg(Day6) = (18.81 + 18.77 + 19.42 + 20.83 + 21.55) / 5 = 99.38 / 5 = 19.876
We dropped the closing price from Day1 (17.32) and added the closing price from Day6 (21.55). We proceed through the rest of the list, dropping the earliest day in the group and adding the next later day. Notice the sum and average computations for Day7 through Day10 in the above table. In effect, we’ve MOVED the 5-day interval down the list each day to compute that day’s average. Hence the name “moving average”. Because this is the simplest method for computing a moving average, it’s called a “simple moving average”, or SMA.
Weighted Moving Average
So far, so good. Simple moving averages, or SMAs, smooth out the variations in day-to-day data so that we can start to see a trend. But the SMA is still susceptible to large one-day changes, and the effect of one larger than normal change will remain in the average for the number of days equal to the interval. In our examples above, an unusual daily change remains in the SMA for the next 5 days. One way to counteract these effects is to give more weight to the more recent data so that anomalies get suppressed quickly.
Enter the Weighted Moving Average, or WMA. We use the same moving interval as above, but we add in a weight factor for each day’s value, with the most recent data having the most weight and each previous day’s weight factor decreases. The weight factor for the most recent day’s data is equal to the length of the interval. In our 5-day model, the most recent day’s weight factor is 5; the next earlier day’s factor is 4, and so on down to a weight factor of 1 for the last day in the interval. The weight factor is multiplied by that day’s value; that is how the most recent data gets more “weight” in the computed average. Let’s recompute the above averages using our new weight factors:
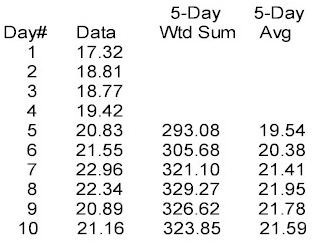
WtAvg(Day5) = ((1 * 17.32) + (2 * 18.81) + (3* 18.77) + (4 * 19.42) + (5 * 20.83)) / (1 + 2 + 3 + 4 + 5)
= (17.32 + 37.62 + 56.31 + 77.68 + 104.15) = 293.08 / 15 = 19.539
Notice that we divided the sum of the weighted values by 15 and not 5; what’s the deal? When we multiplied Day5’s value by 5, we effectively put that value in 5 times; we put Day4’s value in 4 times, and so on. We really didn’t have 5 values to average, we had 5+4+3+2+1 values, or 15 values. So, we had to divide the sum of the weighted values by the sum of the weight factors, or 15.
This method gives decreasing contribution to earlier values; the first day’s value only counts once while the last day’s value counts five times. But there is a more significant effect. Notice in WtAvg(Day5) example, Day2’s value (18.81) counted twice (2 * 18.81), but in WtAvg(Day6), Day6’s value counted only once. So not only does early data contribute less in a WMA, as the average progresses, each previous day’s contribution contributes less while the most recent data always counts the most. If there is a unusually large change in one day’s value, that day’s value will contribute successively less as the average progresses, diminishing that aberration more quickly than in the SMA.
What Does All Of This Mean?
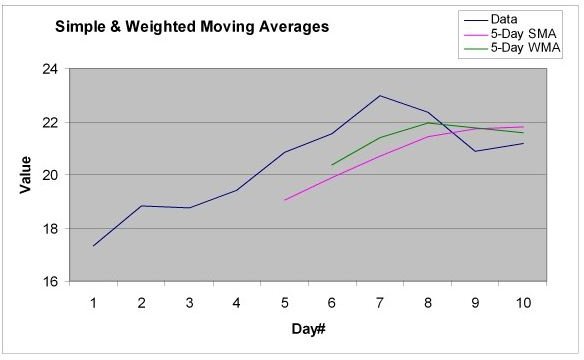
Let’s examine the above graph to see the differences between the 5-Day SMA line and the 5-Day WMA line. The WMA line rises more quickly than the SMA line and also falls more quickly. Why? In the WMA, the more recent data counts for more than the earlier data due to the weighting. So as the data rises from Day1 through Day7 (except for the slight decrease from Day1 to Day2), the WMA should rise more quickly. Also, as the data decreases in Day8 and Day9, the WMA instantly responds by declining while the SMA
still rises through Day9 only to start declining on Day10, two days later than the WMA.
Conclusion
We have shown that a simple moving average, or SMA, can smooth out day-to-day variations in a data series so that we can see the overall trend. We have also seen that a weighted moving average, or WMA, allows the average to react more quickly to changes while still smoothing similarly to the SMA.
That ought to be enough math for now. In our next installment, we’ll proceed to the exponential moving average, or EMA. Because it too is a moving average, we can expect the same variation smoothing to see a larger trend. But the math gets a little more interesting, as does the effects from the math. Don’t worry, the math won’t be so bad that you can’t follow along.


