They say a picture is worth a thousand words. This is probably why a map is so much better than a plain text address in any case. This article will teach you how to create a website with a map in a quick and easy way drawing from the resources already available on the Internet.
There is more than one free way to create a map and include it on your website. Depending on the kind of map and what you want to mark on it, as well as your website capabilities and web knowledge you can use any of the below mentioned methods. This article will show you how to create a web page with a map by utilizing free resources available on the internet, as well as show you how to use them!
Static Goggle Maps Image
Benefits
- Easy to implement
- No JavaScript needed
Usage
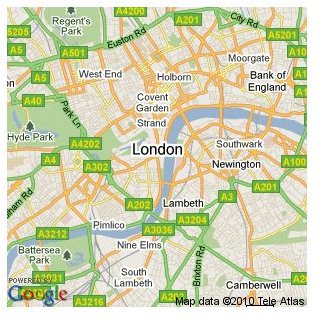
Creating and using a map is as simple as creating an image yourself. For example:
The minimal set of parameters above consists of:
- “size” - the size of the image to generate, e.g. WIDTHxHEIGHT; up to 640px x 640px
- “center” - the location to centre the map on
- “sensor=false” - the sensor parameter, should stay false unless the request comes from a GPS enabled device
Location for the map can be entered in two different ways. You can either use plain english address (just remember to urlencode it), or you can use the longitude and latitude values directly.
Some of the optional parameters you might find useful:
- “format” - the format of the returned image (values include: png8, png, png32, gif, jpg, jpg-baseline)
- “zoom” - from 0 (world view) to 21+ (individual buildings)
Markers
An extra option you can use with the static Google maps API is placing markers on your map. They can be used to highlight a specific location or locations on a single map.
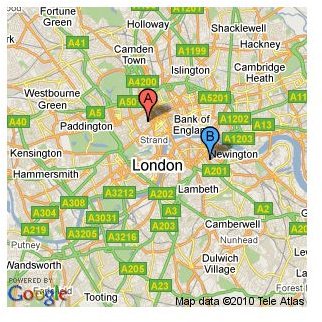
The format of the marker parameter:
color:red|label:A|Soho,+London,+UK
- “color” - hex code or one of the following: black, brown, green, purple, yellow, blue, gray, orange, red, white
- “label” - single character, A-Z or 0-9
- the two parameters above are followed by a list of locations (address or long/lat)
Additional details
Full documentation for all the parameters is available here .
Esri data maps
Benefits
- Easy to use
- Best for US specific data
- Requires an iframe
Usage
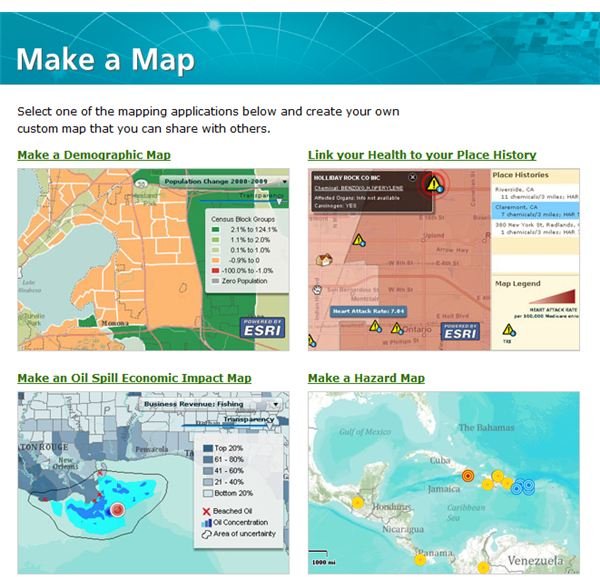
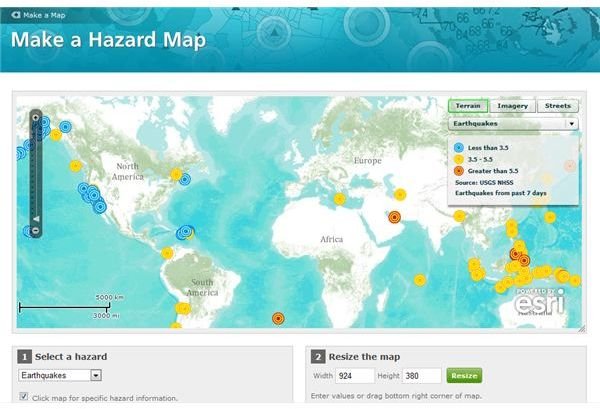
This tool can be especially useful if you are interested in demographics or business data for a US region. The service offers three types of maps:
- Demographic map
- Oil spill impact map
- Hazard map (global)
You can create your map here:
https://www.esri.com/software/mapping_for_everyone/make-a-map/index.htm
Once you have chosen the map type you can easily make the map by filling out the form underneath the preview screen.
When you select all the details for your map you can either use the generated iframe code - just copy&paste it into your page’s html or create a link to fully customized map page.
Dynamic Google maps
Benefits
- Requires some JavaScript knowledge
- Fully customizable
- Interactive maps
Usage
This is the more advanced way of building maps, and it requires a little bit of technical knowledge (especially if you want to build more complex maps), however in return you get a lot more flexibility, customization and most of all maps that can be interactive and dynamically updated if need be.
A good place to start is the tutorial available from Google.
To begin using the JavaScript Google Maps API you need to include the following on your page:
Worth noting is that the parameters for the map are similar to the parameters used by the static maps API.
Lastly you need to actually initialize the map once the page is finished loading. A simple way of doing tht is to call the initialize() function in the body tag:
Or alternativelly if you are already using jQuery on your website:
Additional details
The full Google Maps API documentation can be found here .