The Google Analytics Dashboard is the second page that you see after logging in to your Analytic account & clicking on View Report against your website. The Dashboard is the main section of the Google web Analytics report & there are quite a few things you can do with it. Read more…
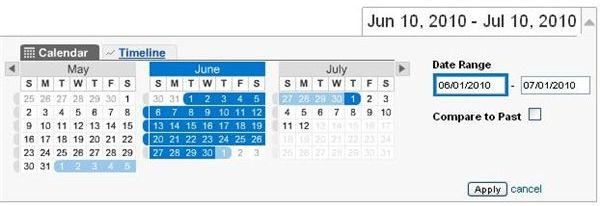
The Date Range Tool
The Date Range Tool available on top of Google Analytics is one of the best features of the Google Analytic Website Dashboard. Clicking on the Tool opens the menu from where you can do
quite a few things like select a single day in the calendar to view reports for that day. If you want to view reports for a week, you can click on any of the half-circles, to the left of each week, or to view analytics reports for a month, you will need to click on the left or right arrow and select a month of the year and finally click Apply.
To view information in a date range, select the first day of your desired range, then select the second day. When you are finished, click on Apply to see the results.
You can also compare data with a previous date’s data. To do so, select your desired date range and tick off the “Compare to Past” option. You’ll notice the previous date range gets highlighted. Select the previous date range and click on Apply button to see the results in your dashboard.
Finally, you can select the “Timeline” tab to see a graphical view of the calendar. It is a fancier calendar, but I prefer the standard one as it is easier to use.
Export & Email
Export and Email is another important and useful feature of Google Analytics Dashboard . Information on web statistics can be saved in an XML or a PDF file. All you need to do is first click on the “Export” button that is located at the top left side of your dashboard and then select the export format i.e. PDF or XML from the small menu that appears. Once done, the data in the chosen file format will instantly be downloaded to your computer.
Clicking the “Email” button opens up the email management page, where you can enter an email address to send the analytics report to. Enter a subject, a description line and select the format you’d like to receive the report in. You can use the “Schedule” option to have Analytics email the report on quarterly, weekly, monthly or daily basis.
Trending Graph
Under the Date-Range tool is the Trending Graph that displays the report in a graphical manner with each point on the graph representing a day,
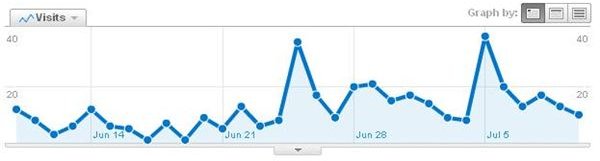
a week or a month. By bringing your mouse cursor on any point on the graph, a small window will appear, showing the number of total visits that took place on that day, week or month. You can click on day, week or month at the top-right side of the trending graph to change the view. By clicking on pages/visit on the top-left side of the graph, a menu appears, where you can select the type of information you want to see i.e. visits, bounce rate, avg. time on site , etc…
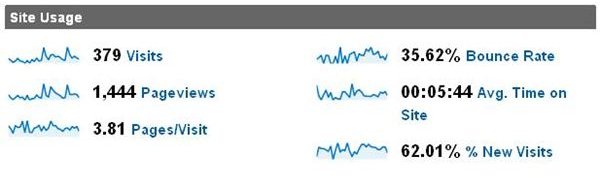
The Site Usage Window
The Site Usage part of Google Analytics dashboard is the only window you can not play with. Here, you will see the very basic information of your website traffic like number of visits, page views, page views per visit, bounce rate, average time on site, and percentage of new visits. This is just a summary of all the information you would want to see for your website.
Visitors Overview
The Visitor’s Overview window gives you a quick snapshot of the unique visitors over time. Clicking on “view report” takes you to the
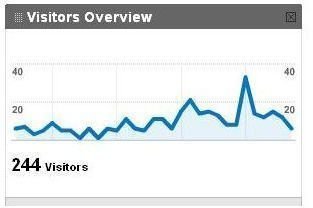
Visitors Overview page where you will find some technical specs and metrics from the dashboard. The important values on this page are absolute unique visitors, pageviews, time on site and bounce rate. The technical information you will get from this page includes visitor’s browser type, operating system, internet connection and other useful information.
Map Overlay
Clicking on “view report” on the map overlay window opens the Map Overlay page where you can see a big world map, showing density of visitors from each country, and their visit details.
Clicking on a certain country on the map will show you
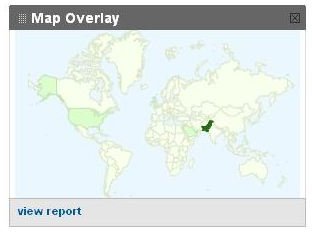
details like cities where the visitors came from, bounce rate, pages/visit, time on site, etc…
Traffic Sources Overview
The Traffic Sources overview window shows you the percentage of visits
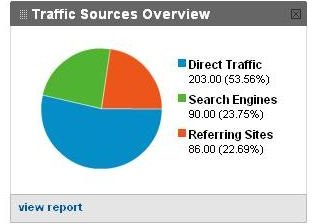
from referring sites, search engines and visits coming directly to the site (i.e by typing the website address). Clicking on “view report” takes you to the Traffic Sources overview page where you can see top traffic sources like websites and the keywords visitors used to reach your website.
You can also use Google WebMaster Tools to get more visitors on your website.
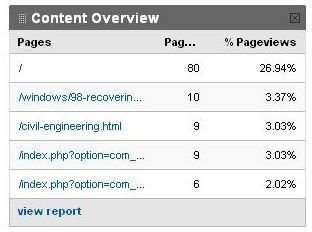
Content Overview
This window shows you a list of top five most visited pages of your website. Clicking “view report” will open the content overview page where you will find more detailed information about the visited pages.
Images Credit: screenshots provided by author