There are several types of charts that are quick and easy to create in Excel 2007, but which is the best to use to represent your data? This tutorial will take a closer look at area charts - when they should be used? And how to create them?
When Should You Use an Area Chart?
Area charts are very similar to line charts in Excel 2007. Both types of graphs provide a good way to demonstrate how certain items change over time or with respect to some other variable.
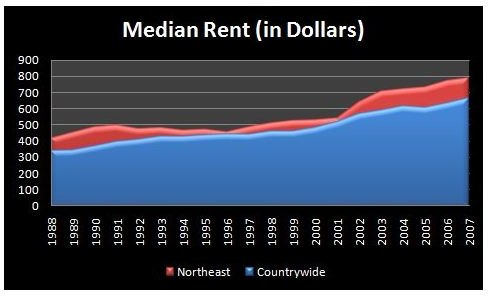
With line charts, the data is plotted on the graph and a line is drawn that basically connects all the data points. Area charts, like the one shown to the left (click any image in this article for a larger view), take this one step further and shade in all of the area under that same line. This makes area charts perfect for demonstrating the difference between two or more quantities over a given interval.
How to Create an Area Chart in Excel 2007
We’ll look at a specific example and use it to show how an area chart can be constructed in Excel 2007.
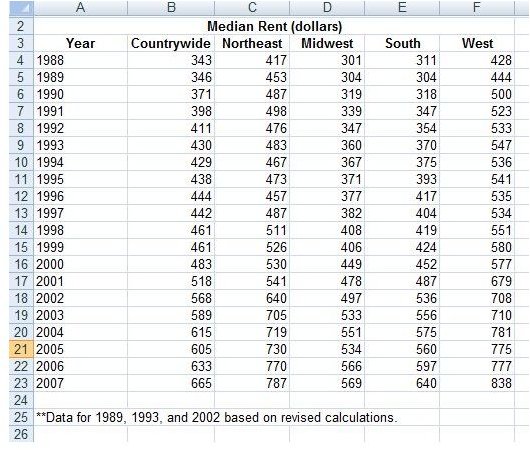
Step 1: The first thing you need to do is enter the data that you want to graph into an Excel spreadsheet. You can either manually type the data or cut and paste it from another source. In this example, we’ll use a table that contains data regarding median rent (in dollars) for the entire United States and for several subregions of the country. In particular, we’d like to graph the Countrywide and Northeast data on one area chart. (Click any image in this article for a larger view.)
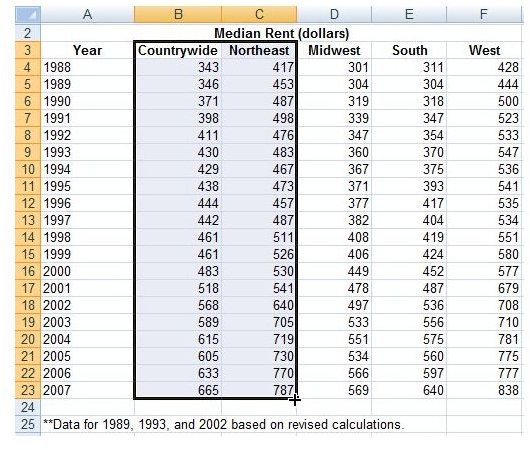
Step 2: Select the columns containing the data that you want to include in your chart. Here, we’ll select the two columns containing median rent data for Countrywide and Northeast.
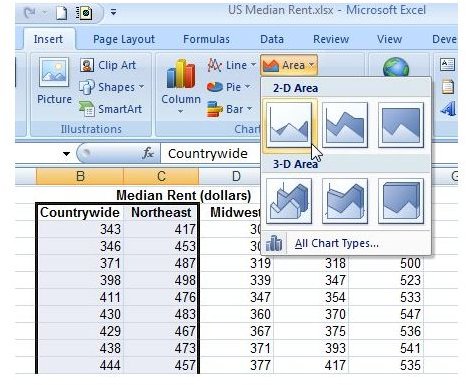
Step 3: Go to the Insert tab on the Excel ribbon. In the Charts category on this tab, click on Area and select the type of area chart that you want to insert. For this example, we’ll pick the first chart in the 2-D Area section.
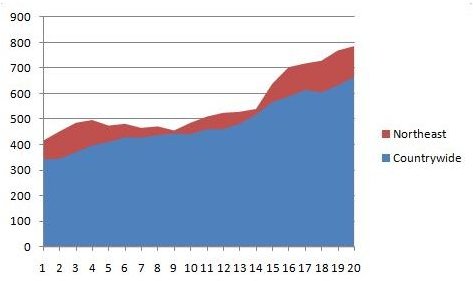
When we do so, we get the chart shown below.
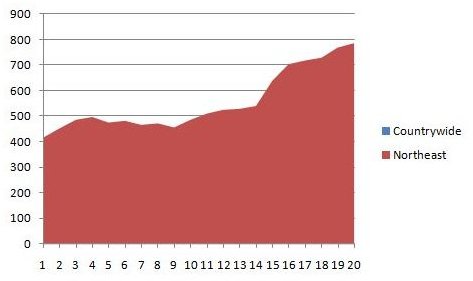
There’s one problem with this chart that can be seen right away – the data for the Northeast region is covering the Countrywide data. This can happen a lot in area charts if you don’t plan ahead. However, there is a quick way to fix this problem.
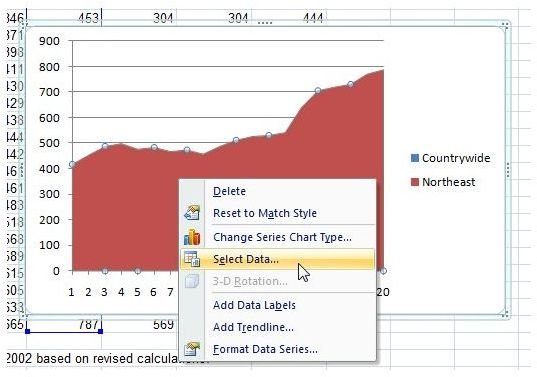
Step 4 (optional): If one of your charted “areas” is hidden in the graph, as is the case in our example, right-click anywhere on the chart and choose Select Data.
After you do this, the Select Data Source window will appear on your screen. We’ll turn our attention to the items listed under Legend Entries (Series).
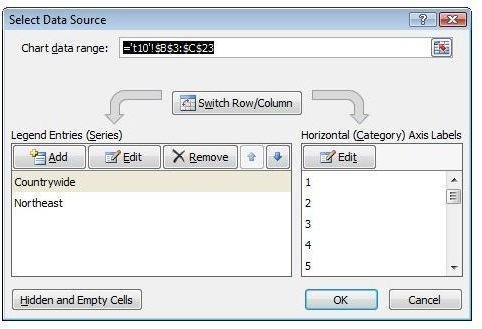
Here, we want to change the ordering of the items in the series so that ones with a smaller area will appear in front of others. To do this, click on the item you want to shift and use the up and down arrows to move it around. In this example, we’ll select Countrywide and click on the down arrow to move it under Northeast.
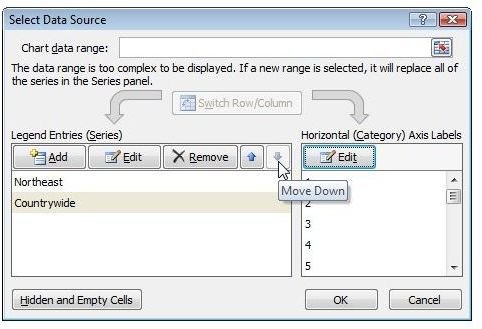
Click the OK button when done and you’ll be returned to your chart in Excel. Now, we can see both of the quantities graphed on the chart.
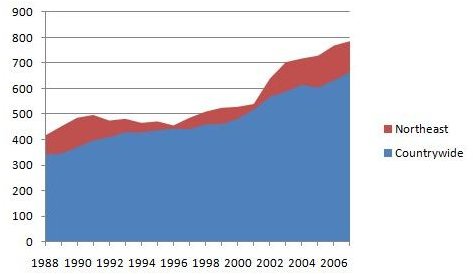
Step 5: The next thing we want to do is make the labels on the horizontal axis more meaningful rather than just a listing of numbers. To do this follow the directions given in Changing Chart Axis Labels in Excel 2007 . After making this change, our chart appears as follows.
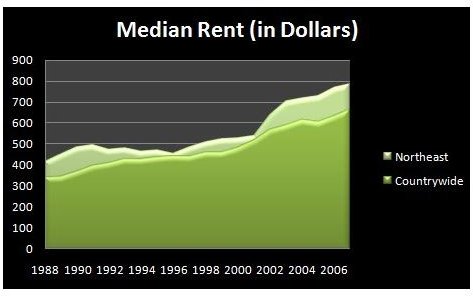
Step 6 (optional): Now, the only thing left to do is format the chart so that it is more visually appealing if you don’t like the default format. To do this, make sure that the chart is selected and then visit the Design, Layout and Format tabs found under Chart Tools on the Excel ribbon. Under these tabs, you can find a wide variety of options that will let you dress up the chart. Below is just one example of the many formats you can choose.
For more tips and tricks, be sure to browse through the other articles in Bright Hub’s collection of Excel chart tutorials . New and updated items are added on a regular basis, so bookmark us and check back often.


