Learn how to run diagnostic tests on your Windows machine. Discover the powerful Perfmon and how it can help you manage your system better. Make the most of your machine and take control!
The amount a computer processor is used depends on the workload it has to contend with. It stands to reason if the system is trying to do many things at once it will spike to 100% utilization occasionally. What it should not do, however, is run at 100% all the time.
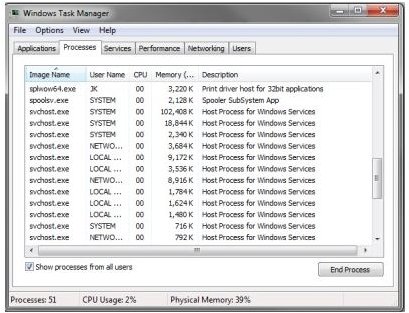
To find out what your computer is doing you need to open the Task Manager. You can do this either by right clicking the task bar at the bottom of your screen or pressing Ctrl-Alt-Delete and choosing Task Manager. At the bottom of the window you should see CPU Usage in a percentage in the middle. This gives you a real time view of how much of your CPU time is being used. Open the Processes tab to examine it further.
You should see a version of the image above which is a list of the currently running processes on your machine. Clicking any of the column headers within the window, where you see Image Name, User Name etc, will sort them by name, or number. Clicking on the CPU header will bring those processes who are monopolizing the processor to the top. In most situations you want to see a process called System Idle Process at the top. This is a Windows process that runs dummy instructions through the processor to allow it to use power saving features like Speedstep.
If you find your processor running a lot at 100%, Task Manager will give you an idea of what is going on right at that moment. If you want to take a longer view and get more of an idea of what has been going on, rather than what is going on, you need to use Perfmon.
Perfmon is a program built into Windows that can give you an array of performance information about your machine. Actually called Performance Monitor, it can be invoked by typing perfmon into the search bar or command prompt.
You should then be presented with a larger window with a red line graph showing your processor utilization. Highlighting the Performance Monitor tab on the left side will bring up the application in full.
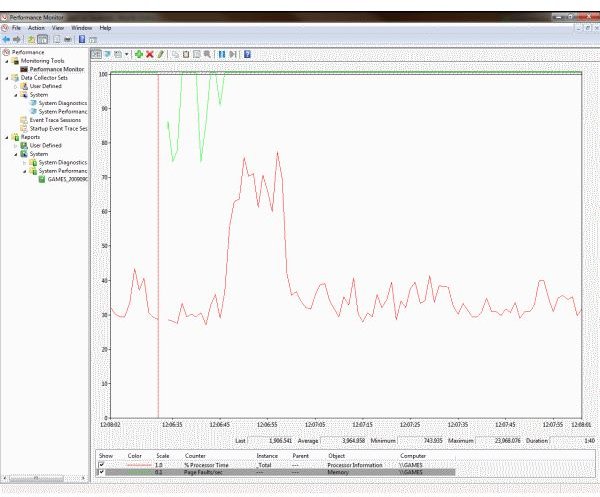
The graph gives a snapshot of what’s going on over the space of two minutes. In the image above there is also a green line which counts memory page errors. Adding elements to the graph is just a matter of clicking the green cross on the top menu and selecting the element then choosing add.
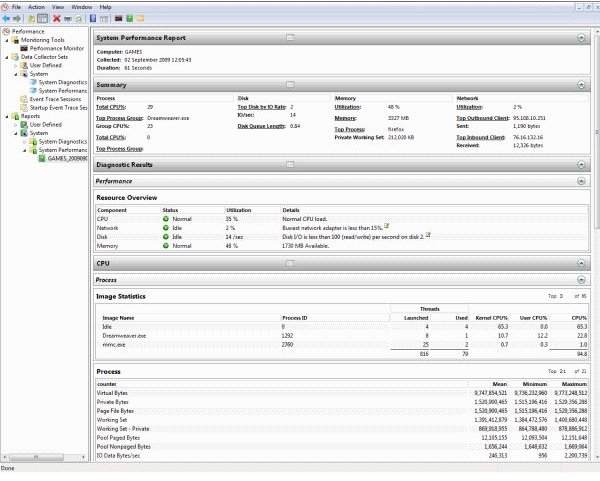
This graph is only part of the usefulness of Perfmon though. In the left menu, select Data Collection Sets, System, then System Performance. A green arrow will appear in the top menu which will enable Perfmon to analyze your system and create a report. Give it a go and see what it shows.
This report is where the true strength of this application lies. It analyzes your system and provides a complete report on the performance. You can drill down into all of the sections, giving you more information than you could possibly need about your system. The report below if from a Windows 7 machine, but other Perfmon reports should look fairly similar.