The MACD is a stock analysis indicator that traders use to determine whether to buy or sell a given stock. It is an indicator of broad trends in a stock’s price. The MACD can be valuable, especially in long-term, but it should never be a trader’s sole determinant of whether to buy or sell.
Overview
The MACD is a Moving Average Convergence / Divergence.It is a stock analysis indicator that was invented by a man named Gerald Appel. It shows the difference between a fast exponential moving average (EMA) and a slow exponential moving average of closing prices. Without getting to far into the mathematical details of calculating an exponential moving average, it is a weighted, moving average where the older data points are given less weight than the most recent data points. This has the effect of making it reflect current conditions more while not getting rid of historic observations altogether.
Simple Math
In equation form, the MACD is as follows:
MACD = EMA[12]– EMA[26]
The numbers in brackets indicate how many days of closing prices you are using to calculate the two exponential moving averages. The shorter the time period (12 days) the less smooth the EMA will be when plotted against time. A plot of the 12-day EMA will be more jagged than a plot of the 26-day EMA. Those numbers, 12 and 26 are not the only ones you can use, but they are the “standard” numbers that most trading software uses by default.
Positive and Negative Indications
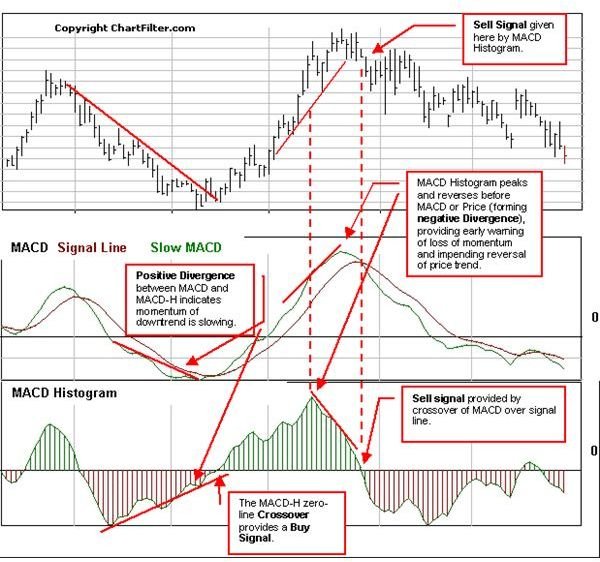
To begin to interpret the MACD, you also need another number: the 9-day exponential moving average of the MACD itself. This is called the “signal line.” Therefore, a usable MACD chart will have four lines plotted on a graph with time on the x-axis and the range of MACD values on the y-axis. The lines are: the 12-day EMA, the 26-day EMA, the MACD, and the signal line. Since the MACD can be either positive or negative number, it is common on a MACD chart to also plot out the horizontal line for y=0. This makes it easy to see where the MACD goes negative.
If you plot the signal line on the same chart , it will look like a smoother version of the MACD. The key to interpreting the MACD is learning three things:
- Where the signal line and the MACD cross
- Which direction the cross is headed
- Whether the cross happens at a negative or positive MACD
Very broadly and generally speaking, these “crossings” indicate a trading rule. When the MACD crosses upward through the signal line, it is one indication to buy. When the MACD crosses downward through the signal line, it is one indication to sell .
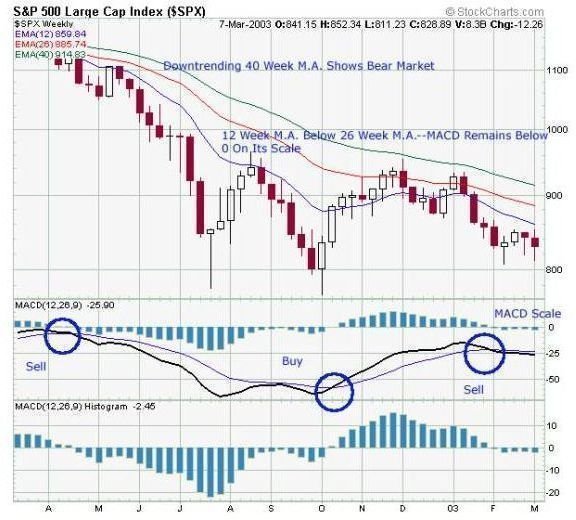
Long Term Indicator
The MACD is a trend indicator that is not meant to be used with very short values for the exponential moving average. In other words, the MACD is more valuable over a period of weeks than it is over a period of hours. Success with the MACD only comes when it is part of an overall trading strategy. In fact, if you only use the MACD, you will do about as well as you would basing buy and sell decisions on a “heads or tails” game. In general, the MACD alone is considered a fairly week predictor of price direction.
is MACD Out of Fashion?
Since the era of computerized trading, the MACD has been criticized for its lack of responsiveness in volatile market conditions. Most trading strategies now use the MACD as a monitoring technique only. If you rely solely on the MACD, you are more likely to “whipsaw,” or buy high and sell low, to put it simply. With leveraged trades or trading in options, even more caution is advised when using the MACD.
The MACD will probably always have its place in the stock trader’s bag of tricks, but relying on it solely to make buy and sell decisions is not a good idea. As economist John Maynard Keynes noted, “The markets can remain irrational longer than you can remain solvent.”


