Many investors rely on charts in the investment sectors like stock market and currency trading market. Perfect use of charts can be extremely helpful for you in identifying the best stock picks and currency pairs to carry out the transactions.
Introduction
Charts play a vital part in the lucrative investment markets, whether it is stock market or forex market. The decision of offloading the stocks or selling off the currencies and also the decision on buying new stocks or buying another currency in lieu of selling of the first currency requires careful analysis of the charts in the respective fields. You can become a successful investor in any of these markets, if you have necessary tools to make proper decisions on investment opportunities. Charts are one of the best and easiest tools to analyze the markets with and also to predict future trends in the markets.
What is a chart? Why use them?
There are many types of charts available in forex market and stock market. Basically charts are the graphical representation of the data corresponding to the trade. Charts use basic data from the stock market prices of each and every stocks traded in the stock market. In forex charts it uses foreign exchange currency values. The information from the investment markets are graphically represented in charts and it helps the investing community to understand the intricacies and dynamism of the market. Charts help investors to understand the performances of various investment instruments over a period of time. The advent of Internet networks and the explosion in software development have made it possible to display charts online by using live trading data.
Chart types
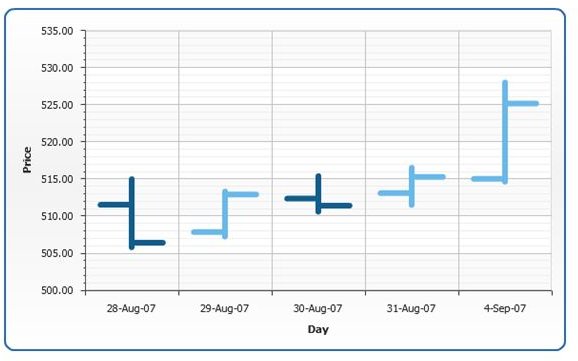
Some of the various chart types available include OHLC (Open, High, Low and Close) charts, Candlestick charts, Point & figure charts, bar charts and line charts. OHLC charts are basically bar charts. OHLC charts displays the past and present market values of the stocks in a four way format namely open price, high price, low price and close price. Each of these prices can be separately analyzed to gather valuable information of the health of the stock, investment opportunities in the stock and also expected future trends.
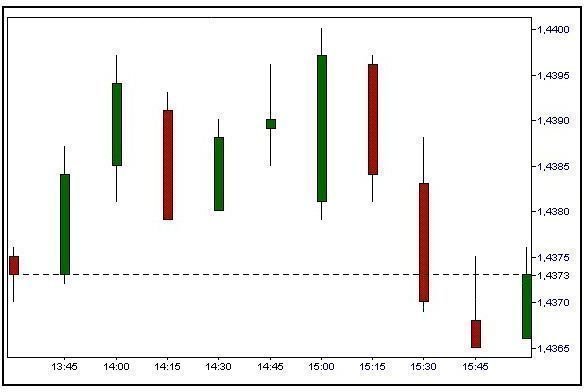
Candle sticks charts are another kind of useful charts. This chart emphasizes the interest of the buyers and sellers. This chart represents the price movements of equity over a certain time. It is used for technical assessment of the stock prices and currency prices. It is a combination of bar charts and line charts with a bar representing the full range of prices, and a line to the left representing the opening price, and one to the right representing the closing price.
Line charts are the simple form of charts with lines representing the price movements in the stock market.
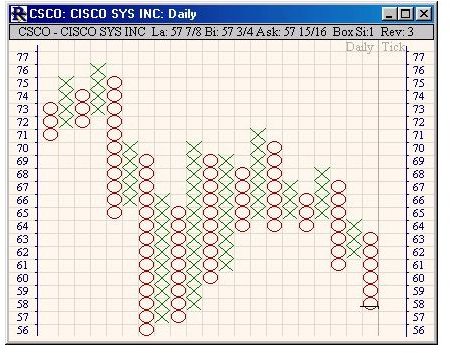
Point & Figure Charts do not use the time factor in representing the movements of the market. These charts are mainly used to locate the support and resistance levels in the market. It concentrates intentionally on the movement of the price only with a column of X’s representing rising prices and a column of O’s representing falling prices.
Chart types