Improve Your Website Content with Google Analytics Report Data
Google Analytics Content reports will help you evaluate website performance in terms of content. Learn which reports will help you most with this report overview.
TechImprove Your Website Content with Google Analytics Report Data
Google Analytics Content reports will help you evaluate website performance in terms of content. Learn which reports will help you most with this report overview.
Advertisement
Quick Take
Google Analytics Content reports will help you evaluate website performance in terms of content. Learn which reports will help you most with this report overview.
On this page
Content Reports Overview
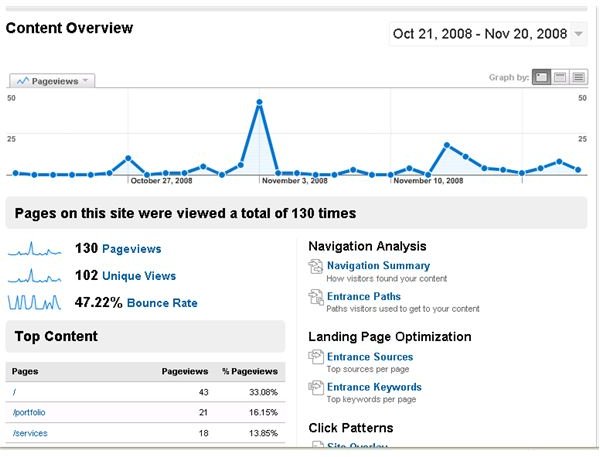
The Content section of Google Analytics can be found by logging into your Google Analytics dashboard, and clicking Content and then Overview. This report will provide a look at all the information in the Content section, and will look something like this:
The information you’ll find in this section of Google Analytics is:
Advertisement
Top Content:Article ImageProvides you with a look at the most popular pages on your website so you can continue to optimize them for users.
Content by Title: Provides you with a look at the content views by page title so you can continue to optimize them for users.
Content Drilldown: Gives you a look at the content views by directory, so you can look for patterns in user activitiy on the site and continue to optimize.
Top Landing Pages: Find out which pages visitors land on the most. This lets you optimize those pages, and have another way of keeping track of ad campaigns and social networking efforts.
Top Exit Pages: Provides you with a look at the most popular pages people are leaving your site on so you can get a glimpse of user activity, continue to optimize, and track ad campaigns.
Site Overlay: Will open your site in a new window to show you the most popular areas clicked on the site.
Site Search: This feature must be implemented and set up within Analyitcs if your site has an internal search function. More information on this will be covered in the site search article later in this series.
On this overview, you will also find great features like:
Navigation Analysis: This will give you a glimpse into the users mind, as you get to see how an average visitor moves through your site–where they come in, what they check out while visiting, and where they leave.
Advertisement
Landing Page Optimization: This will help you make sure the page you have your users coming in on is optimized for them to keep them there long enough to explore other areas of the site.
As with any other Google Analytics report, you will also find a graphical representation of your visits throughout the specific date range chosen, along with information on the total number of visits, the percentage of new visits, the bounce rate, the number of page views, and the average time spent on the site.
Advertisement
This post is part of the series: Improve Your Website Content with Google Analytics Report Data
Learn about all the Google Analytics Reports under the Content area. This will help you understand more about your website content and help you make it better to get more traffic and higher conversions.