Want to see which content on your site is doing the best in terms of page views and bringing in traffic? The Top Content report in Google Analytics will help you do just that. Read on to find out more about how to use this report in your internet marketing ventures.
Report Overview
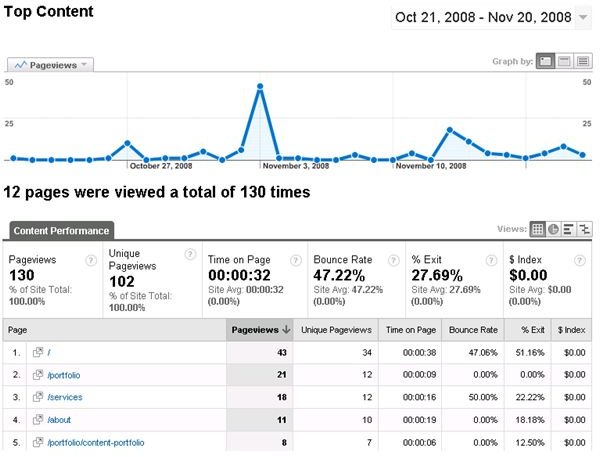
This report is accessed by logging into your Google Analytics account, clicking Content, and then clicking Top Content. This report will show you the top pages of content in your website based on:
- Page Views:This is the total number of page views for the specified date range.
- Unique Page Views: This is the number of page views out of the total coming from new visitors to the site.
- Time on Page: This is the average time the user spent looking at the page.
- Bounce Rate: This is the percentage of people who click onto the site and click on to something else very quickly, because your site did not provide what they were looking for or they did not mean to arrive at it in the first place.
- % Exit: This is the percentage of users who exit the site after viewing the page.
The report looks something like this:
Making this Report Work for You
The important part of this report is knowing how to interpret the data and what it means for you and your site. Taking this data and using it to predict user behavior and therefore altering the site content to match what you believe the user behavior indicated of the changes necessary, makes for a better site.
So for instance, let’s say you have a very popular page, because everyone clicks ojn it and visits it, yet, everyone leaves the site after they see it. They don’t go on to explore anything else at the site, which most of the time probably means you are not making money.
What you need to do is alter the content of that page just enough to make it grab their attention. Do not sacrifice any SEO efforts that you have been making with keywords and so forth. However, you may want to consider looking at which words are being used to make that such a popular page, and then change the information there to make it more pertinent to your website users.
Take a look at each page, and see if you can figure out what makes it so popular. If you can then translate the same thing over to all the pages, you should be one step ahead. Watch for trends after you make changes. Do people stick around longer and explore more of the site? Or, do people leave quicker? Be prepared to backtrack any changes you make because your interpretations of what the audience wants may not always be correct.
This post is part of the series: Improve Your Website Content with Google Analytics Report Data
Learn about all the Google Analytics Reports under the Content area. This will help you understand more about your website content and help you make it better to get more traffic and higher conversions.
- Improve Your Website Content with Google Analytics Report Data
- Google Analytics Reports: Top Content
- Google Analytics Reports: Content by Title
- Google Analytics Reports: Content Drilldown
- Google Analytics Reports: Top Landing Pages
- Google Analytics Reports: Top Exit Pages
- Google Analytics Reports: Site Overlay
- Google Analytics Reports: Site Search