If you are not sure about that flash video on your site, you can use the Browser Capabilities Report in Google Analytics to tell you more about the flash version that your users have installed on their systems. This way, everyone can use your site with no problem. Read on to find out more!
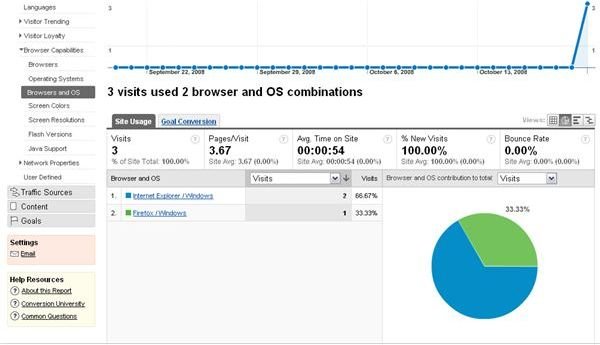
The Browser Capabilities Report is located inside the Analytics Dashboard in the Visitors section. The screen will look something like this:
This report will provide you with six different aspects about the computer and browser being used to look at your Web site. This will help you ensure that your design and development cater to everyone in your target audience.
The six different variables tracked by the Google Analytics Browser Capabilities Report are:
Browsers: This will show you the browser the user is using to view your site. Make sure your site is optimized for the majority of the browsers that you see on this list. The most common are Internet Explorer and Mozilla Firefox.
Operating Systems: Though this doesn’t really have much bearing on your site itself, it is good to know as you may be offering products that are not compatible with all operating systems in use. If not, knowing the OS gives you an advantage in learning about what versions of programs that are needed to view your site (the browser, flash player, java, etc.) and are supported by the user’s computer. Though most people use either Windows XP or Vista, there are a few visitors that use older versions and some even still who use open source operating systems.
Screen Colors: Many monitors display millions of colors. Though between PC and Mac, there are only 216 colors that show exactly the same. These are known as Web safe colors. Knowing the screen colors (8 bit, 16 bit, 32 bit, etc.) will help you determine how well the colors that you intended are actually coming across for design and readability.
Screen Resolution: The standard Web design resolution is 800 x 600. Though with the advent of flat panel screens, HD displays and increased cell phone browsing, this is rapidly changing. The resolution effects the size and clarity of your Web site in the browser and helps to prevent the need for scrolling. You should optimize for the most popular resolution while also considering what your site looks like in others.
Flash Version: If your site requires flash player for any component to display correctly, you need to know what version people are using so that you can make sure your files are compatible with it. Not everyone always upgrades when a new version is released, and some of the newer capabilities in the flash player are not backwards compatible. Optimize your flash for the most common version, and offer a link to download the most recent version to solve the compatibility issue.
Java Support: For certain programming features and games, your site will need Java to function. Like the Flash issue, the computer that the site is being viewed from must have the appropriate Java support in order for it to work correctly. Optimize for the most common version that you see in the results, and offer a link to download the most up to date version to aid this problem.
There is also a Browsers and Operating Systems report, which combines the information from the browser report and the operating system report to help you see correlations and trends.
Knowing these facts will help you adjust your testing computer’s settings in order to best match your target audience computer. When you are looking at your site through the eyes of a user, you will be able to see how he or she experiences your site. And, you can do more to squash any bugs and work out design discrepancies between browsers if you know what your audience is working with.
This post is part of the series: Learn More about your Visitors with Google Analytics
This series takes a detailed look at the reports offered in the Visitors tab in Google Analytics. Learn about all the reports, what they track, and how you can use them to improve your site.
- Google Analytics: Learn More about your Visitors
- Google Analytics Reports: Benchmarking
- Google Analytics Reports: Map Overlay
- Google Analytics Reports: New Vs. Returning Vistors
- Google Analytics Reports: Languages
- Google Analytics Reports: Visitor Trending
- Google Analytics Reports: Visitor Loyalty
- Google Analytics Reports: Browser Capabilities
- Google Analytics Reports: Network Properties
- Google Analytics Reports: User Defined