Network Properties will help you learn about your target audience’s Internet connection in three different aspects. Knowing this information will help you determine the content load and media types that your site can handle while still serving your audience as well. Keep reading to find out more.
The Network Properties report is in the Visitor menu in your Analytics dashboard and will offer three different sub-reports to zero in on
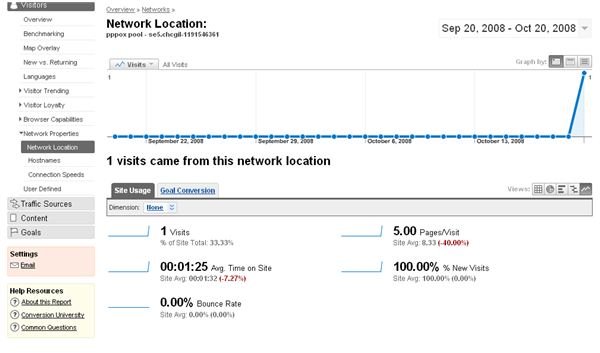
more specific information. When you are looking at the Network Properties report, you should see something like this:
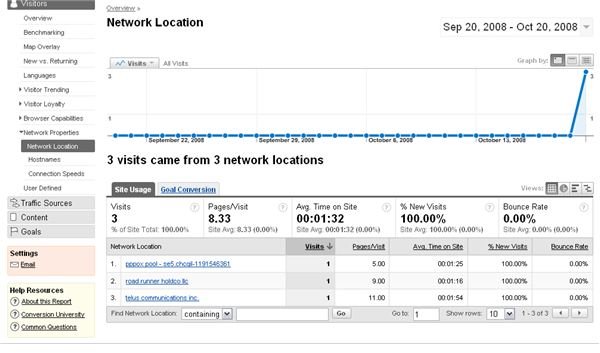
You will notice each one of the networks, hostnames and connection speeds are a hyperlink. By clicking on any one of these, you will be able to get an even more detailed report about that specific network, hostname or connection speed. The detailed report is represented by the second screen shot.
The three sub reports that you see are:
Network Location: This will tell you about where the network that the user is connected to is. This is what provides you with information about the ISP that the Web user is connecting to the Internet with. While this is not too relevant, it helps solidify the location of your audience. Though speaking from personal experience, I have seen my network location show up in an area about 60 miles from my actual location. Google Analytics will be more reliable than the Analytics that brought this result. Yet, you should consider this when it comes to the accuracy of the information.
Hostnames: This is merely a phrase for the domain name. It helps to see whether or not you have several domains pointing to the same Web site. So, you can see where most of your traffic is coming from in terms of advertising. Certain domains will work better than others depending on various factors. So, if you are using more than one domain name, you should take heed to which ones are effective and consider ditching the others.
Connection Speeds: This is likely the most useful of all three sub-reports because it will tell you about the speed of the connection the user has, which means you will be able to tell more about how long it takes a page to view. It will also tell you whether or not they would be able to handle large file downloads in a timeframe that is short enough to remain user friendly. Web browsers are typically impatient so you should not keep them waiting with downloads when you do not need to.
This report will probably not be as useful as some of the others. When, however, it comes to new development and features for your Web site, you will be able to tell whether or not your users can handle the bandwidth and download times based on the information in this report.
If you haven’t already done so, be sure you check out the rest of this series. And, stay tuned for our last article, where you learn about the User Defined report.
This post is part of the series: Learn More about your Visitors with Google Analytics
This series takes a detailed look at the reports offered in the Visitors tab in Google Analytics. Learn about all the reports, what they track, and how you can use them to improve your site.
- Google Analytics: Learn More about your Visitors
- Google Analytics Reports: Benchmarking
- Google Analytics Reports: Map Overlay
- Google Analytics Reports: New Vs. Returning Vistors
- Google Analytics Reports: Languages
- Google Analytics Reports: Visitor Trending
- Google Analytics Reports: Visitor Loyalty
- Google Analytics Reports: Browser Capabilities
- Google Analytics Reports: Network Properties
- Google Analytics Reports: User Defined