Compare your site to others in your industry with Google Analytics and the Benchmarking Report. Use it to help you decide what site changes to make, when to run specials, and more.
The Google Analytics Benchmarking Report allows you to compare your website to other’s in your niche anonymously. Don’t worry; Google removes all identifying information before releasing your statistics to others.
To access the Benchmarking report, you click View Reports to get to your main dashboard.
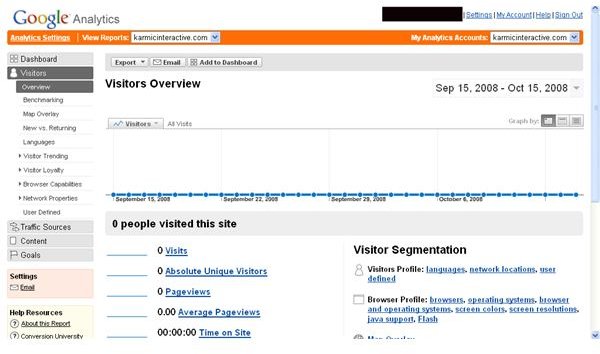
From there click Visitors on the left side, and then click Benchmarking. You’ll see a screen that looks something like this:
The Benchmarking feature was added to Google Analytics in March 2008. It’s very’ useful in helping you compare your site to your competitors, as it will help put thing in perspective.But remember, all websites are different, and certain elements in the code may change the way search engines view the site.So, you should not get too disappointed if the site comparison is not in your favor.
Benchmarking will show you six different statistics.
Visits
The number of times a viewer has come to your site.When 30 minutes of inactivity have elapsed from the same IP address, Google Analytics will count it as a new visit. A tracking code can be added to change the time Analytics uses to determine a new visit.
Pageviews
The number of times a file has been sent from your host to the user browser, this includes HTML and media files.
Pages per Visit
The average number of pages a person looked at while they were visiting your site.
Average Time on Site
A measure of how long users spend using your site.
New Visits
The number of visitors to your site who had never visited before.
With each of these reports you can click a link to go to a related report to help you further analyze your data.
The Benchmarking service works for people who decide to share their site information with the system, and therefore does not represent all competition. If you are interested in sharing your site data for Benchmarking, here is how you can do it:
Go to the Analytics Account Settings page—the first page you see when you login to your account.
Click Edit Account and Data Sharing Settings and then click Anonymously with Google and the benchmarking service. This option will no longer be available if you have already elected to share your data.
To change the date range for your report, simply click the arrow by the date range in the upper left of the report. Enter your dates in each box. Click Apply. This will change your data for the specified date range so you can focus on a specific date, week, or period of time to watch for trends.
Why would you want to use Google Analytics Benchmarking? Perhaps you are experiencing a slow time and you want to see if it is affecting others in the industry. Maybe you are experiencing more sales and you want to see if anyone else is… maybe it is more traffic. Whatever it is, you will be able to find out if you need to make adjustments or if the issue does not lie within your site.
If you see the trend is industry wide, you can decide to leave your site as is, or maybe run a special to try to get more customers to your site. If the trend is not industry wide, you should either celebrate your success or make changes to eliminate the cause of poor performance.
This post is part of the series: Learn More about your Visitors with Google Analytics
This series takes a detailed look at the reports offered in the Visitors tab in Google Analytics. Learn about all the reports, what they track, and how you can use them to improve your site.
- Google Analytics: Learn More about your Visitors
- Google Analytics Reports: Benchmarking
- Google Analytics Reports: Map Overlay
- Google Analytics Reports: New Vs. Returning Vistors
- Google Analytics Reports: Languages
- Google Analytics Reports: Visitor Trending
- Google Analytics Reports: Visitor Loyalty
- Google Analytics Reports: Browser Capabilities
- Google Analytics Reports: Network Properties
- Google Analytics Reports: User Defined