Learn about what the Map Overlay feature is and what it offers you in order to help your Web site better reach its goals.
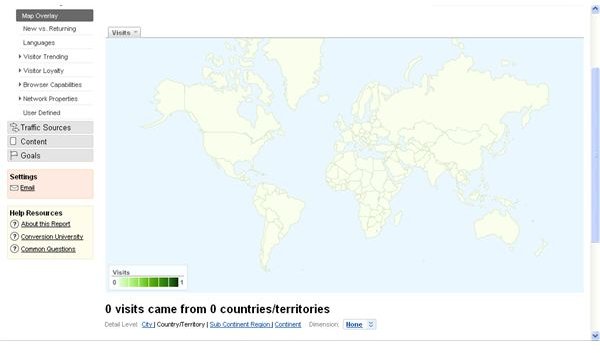
In continuing with our series on Google Reports on Visitors, let’s move forward and take a look at the Map Overlay Report. The Map Overlay Report can be accessed from inside your Google Analytics Panel by clicking View Reports, then clicking Visitors, and finally clicking Map Overview. You should see a screen that looks something like this:
The map will show dots representing the locations of the visitors coming to your site. The darker the color of the map,
the higher concentration of visitors you have coming from that particular area. You will also see a chart for the site usage that will show the number of visits to the site, the pages per visit, the time spent on the site, the percentage of new visitors and the bounce rate.
You can change the amount of detail that you see by clicking Detail Level on the drop down box. You will be presented with the following options:
- Country/Territory
- City
- Sub Continent Region
- Continent
You should also see an option for dimension underneath the map, but above the report showing the percentages. There you will be able to choose from the following statistics to show on the map.
- Source: tracks the origin of a referral to your site.
- Medium: tracks the way a visitor to a site received the link to that site, including manually typing the URL (organic), cost-per-click, etc.
- Campaign: the advertising campaign you are using.
- Keyword: the search query helping the user to find your site.
- Ad Content: the content of the ad bringing the user in.
- Visitor Type: tells you if the visitor is new or has been to the site before.
- Landing Page: the page the visitor came into your site on.
- Language: the language the visitor viewed your site in.
- Browser: the browser the visitor viewed your site in.
- Operating System: the operating system used by the visitor.
- Screen Colors: the colors the screen is capable of displaying.
- Screen Resolution: the resolution of the user’s screen.
- Flash Version: the version of flash player the user has installed on their system.
- Java Support: the version of java the user has installed on their system.
- Network Location: the location of the ISP or network being used to connect to your site.
- Hostname: the name of the computer
- Connection Speed: the connection speed your user has and is using to view your site.
- User Defined: based on the specifications you set. This will be etailed in a future article.
Using the search box underneath the report data, you can find the data for a particular country or area based on your search string. Remember, you can change the date range for the information by clicking the arrow on the drop down box in the upper left corner of the screen and entering the dates you want.
Why is this information important to you? By knowing where your consumers are coming from you, you will be able to properly adjust your advertising and other information to help better serve them, and you will be able to better spend your advertising budget by geo-targeting . Geo-targeting is the targeting the residents in a particular area of the country or the world. With this information at hand, you will better be able to specify and reach the goals for your Web site as well as see how you are doing in terms of meeting them.
This post is part of the series: Learn More about your Visitors with Google Analytics
This series takes a detailed look at the reports offered in the Visitors tab in Google Analytics. Learn about all the reports, what they track, and how you can use them to improve your site.
- Google Analytics: Learn More about your Visitors
- Google Analytics Reports: Benchmarking
- Google Analytics Reports: Map Overlay
- Google Analytics Reports: New Vs. Returning Vistors
- Google Analytics Reports: Languages
- Google Analytics Reports: Visitor Trending
- Google Analytics Reports: Visitor Loyalty
- Google Analytics Reports: Browser Capabilities
- Google Analytics Reports: Network Properties
- Google Analytics Reports: User Defined