How to Create a Chart in Publisher 2010
Getting Started
Before you create a chart in Publisher 2010, you need to decide where you want it and what information you wish to display. This can help you determine the type of chart you want to make, as well. There are many chart types available, so select the one that fits into your publication and presents your data in the best manner.
For example, a column chart shows comparison and a line chart presents a trend, while a pie chart displays the “big picture.” Do not worry if you change your mind later, though, as changing the chart type after you create the chart in Publisher is quite simple.
Creating the Basic Chart
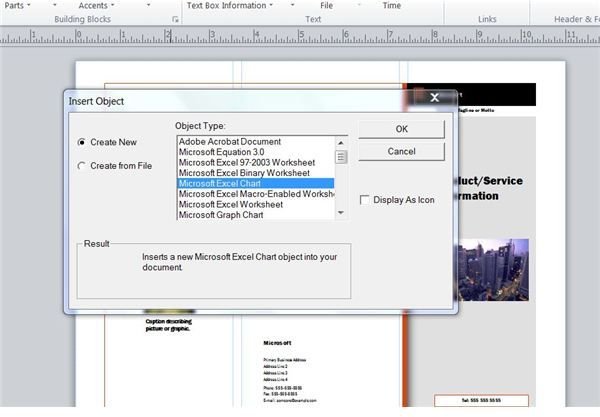
Once you have a good idea of where your chart will go and how it should look, open your publication and place the cursor where you want to create the chart. Go to the Insert tab and click on Object in the Text group. The Insert Object dialog box opens. Click on Microsoft Excel Chart and click OK. (Click on any of the images below to enlarge.)
**
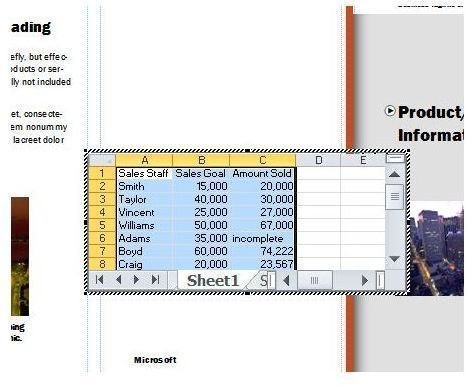
A sample chart appears in the Publication, and a Chart Tools tab appears on the ribbon. Beneath the Chart Tools tab are three more tabs: Design, Layout and Format. Click on the Sheet1 tab of the chart. Delete the sample data and enter your own.
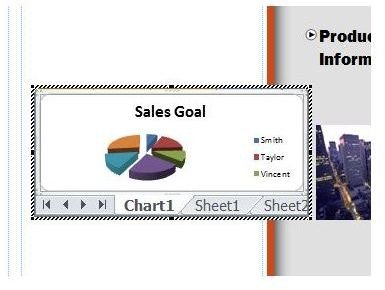
Go back to the Chart tab. If you cannot see it, click the Back Arrow button to the right of the tabs until you do. Your Publication now has a chart that displays your data using Publisher’s default chart type.
Formatting the Chart
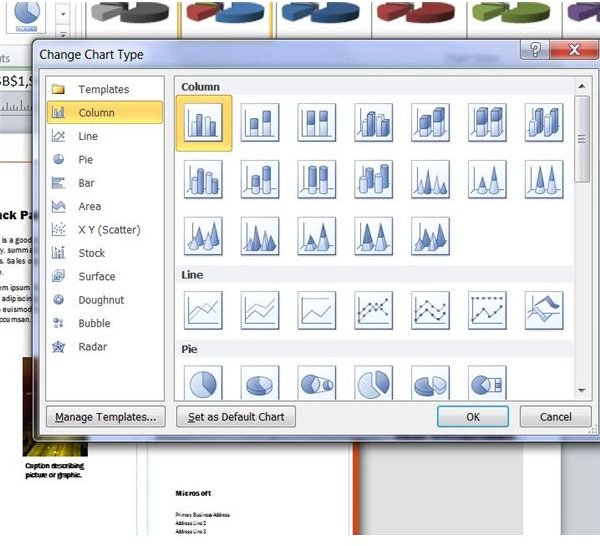
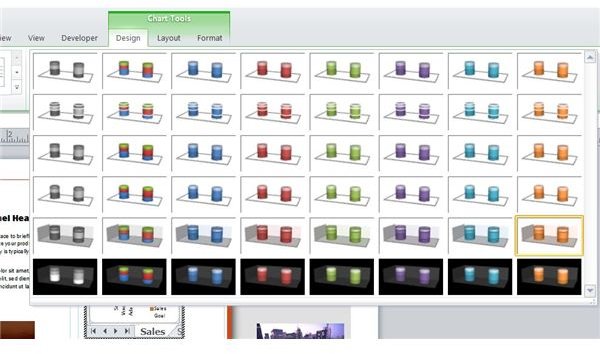
If you don’t like the way the chart looks or if you want a different chart type, Publisher makes it easy to change. Click on the chart to activate the Chart Tools tab. To select a different chart type, go to the Design tab. Click on in the Type group to open the Change Chart Type dialog. Click on the type of chart you want to use and then select the subtype. Click OK to apply the changes.
Use the Chart Styles feature to change the color scheme of your chart so that it coordinates with your publication. You can choose a different layout in the Chart Layout group, as well.
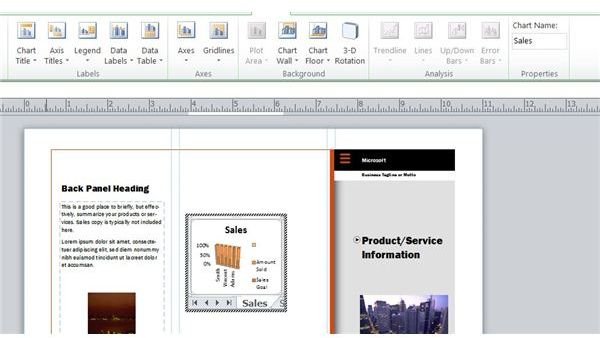
Go to the Layout tab under Chart Tools for many other formatting options. Change or hide chart labels in the Labels group. You can also change the appearance of the background or format the 3D rotation settings using the options in the Background group. If you want to change the name of the chart, simply enter it into the Chart Name box.
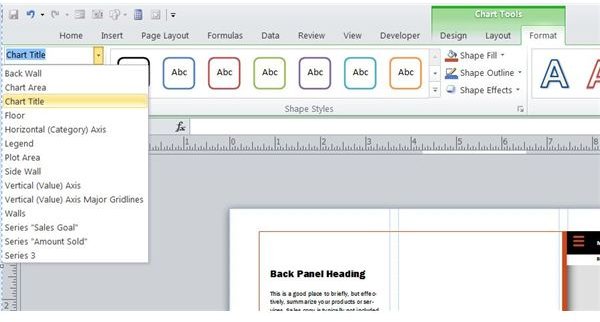
Go to the Format tab under Chart Tools for a few more options. Choose an option in the Current Selection list to change its formatting. Choose shape styles or effects to format the appearance to your specifications. If you change your mind, click Reset to Match Style in the Current Selection group.
Finally, if you want to move, rotate or resize the chart, you can do so manually. Simply grab the chart and move it to the location you want, rotate it using the green Rotation Handle at the top of the chart, or resize it by dragging a border of the chart.
Once you create a chart in Publisher 2010, be sure to save your changes before closing the publication.