
Find a free, downloadable Excel pro forma income statement that owners of start-up or small-venture businesses can utilize. It would be best for start-up entrepreneurs to get into the practice of writing down future projections because of the complexities of today’s volatile market
The Importance of Estimating Future Business Projections
Some entrepreneurs simply don’t bother putting their thoughts and observations about business-trends into projection plans. They think of their respective businesses as too small and the outcomes are readily predictable even without using an Excel pro forma income statement.
However, prices could rise unexpectedly or new products created by advancing technologies could negatively impact a start-up venture. Often, the weight of their maturing payables bogs them down, because the goods on which they stocked-up aren’t selling.
Keeping abreast with business trends is quite important, but a better practice is to monitor their effects on one’s business operations. That way, funding and spending decisions are kept in check. Although business projections are merely based on guesses, it’s better than being hit with unexpected and adverse surprises.
In order to make this seemingly tedious procedure much easier, a simple Excel pro forma income statement would be the best medium to use. Users can utilize it by simply editing its present content and replacing the values with their next set of future projections.
We’re not going to leave it at that though, because the following sections will walk you through making those future projections using the Excel pro forma income statement template, available for download at Bright Hub’s Media Gallery. You can also find another version in a compatibility mode .
A Guide to Creating an Excel Pro Forma Income Statement
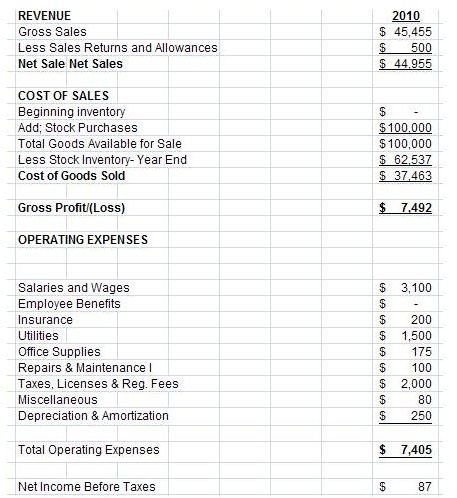
Click on the image of the sample income statement on your left to get a larger view, since all projections will use the values reflected therein as givens. Our first assumption is that this will be the income statement at the end of 2010.
We will refer to their values as historical figures, and post our calculated assumptions in the Excel pro forma income statement.
Gross Sales
In year 2010, sales increased at an average rate of 1.5 percent per month and the owner expects to maintain the same trend throughout year 2011’s operations. In which case, this will be computed as:
Projected Rate of Gross Sales Increase for 2011 = 1.5% x 12 months = 18%
Projected Gross Sales 2011 = $45,455 x (100% + 18%)
= $45,455 x 118% = $53,637
- Post $ 53,637 to cell J13
Sales Return and Allowances
(1) Since this represents defective merchandise that was returned, the business owner’s projection for the succeeding year should be to minimize, if not totally eliminate, the occurrence of such returned items.
(2) It is possible that some of these goods are still included in the current inventory; thus, we will project the same amount of $500 for 2011.
(3) Post $500 to cell J14.
Beginning Inventory
In our historical costs, the business has just started in 2010; hence, there is no existing inventory. However, since 2011 is its second year, the dollar value of the stock-inventories ($62,537) at the end of 2010 becomes the 2011 beginning inventory.
- Post $62,537 to cell J18.
Stock Purchases
(1) Take note that a large part of the 2010 purchases remains on hand, which amounts to $62,537 while the projected sales for 2011 are targeted at $53,637.
(2) This should raise the owner’s awareness about making a clear study on which goods are selling poorly, moderately, or rapidly.
(3) In addition, the entrepreneur should be on the lookout for the latest products but test their viability first, before fully stocking-up on them.
(4) In the event that poor-selling products will still remain unsold, the owner should sell them at a discounted price before the year ends.
(5) The estimate for future stock purchases should be limited by the equivalent cost of goods sold for the 2011 projected sales.
(6) In determining the estimated cost of goods sold, calculate the purchase cost by dividing projected sales at 120%, assuming that the mark up on prices is at 20%. For this purpose we arrived at the amount of $44,698, based on this computation: [$53,637/1.20 or (120%/100%)]
(7) Hence some of the funds for purchases should come from selling the slow-moving goods, and provide only a minimal amount of additional purchases for 2011. However, in actual practice, one can always go beyond the projected amount if the demand for the new product has a good turnover rate.
(8) Remember, these are only guesses but the accounting principle of conservatism should be observed – thus, we project $5,000 only for additional purchases. This may increase but will depend on the viability of the items.
(9) Post $5,000 to cell J19
Please continue on page 2 for more on working with the Excel Pro Forma Income Statement
As you continue to work with the Excel Pro Forma Income Statement, you will also consider:
Total Goods Available for Sale
Cell J20 will automatically add the values in cells J18 and J19; hence there is no amount to post.
Stock Inventory – Year End
(1) Since we made it a point to limit our cost of goods sold to $44,698, our estimated inventory will be the difference between the total goods available for sale ($67,537) and the cost of goods sold ($44,698), which is $22,839.
(2) Stock Inventory at year-end is expected to dwindle down to $22,839 by selling the slower-moving goods at discounted prices and by limiting the purchases.
(3) Post $22,839 to cell J21
Cost of Goods Sold – The amount for cell J22 is automatically generated.
Gross Profit (Loss) - The amount for cell J24 is automatically generated; Net Sales (J15) less Cost of Goods Sold (J22).
Operating Expenses
(1) You will notice that our historical figures resulted in a net income at near break-even point. This was made possible by working out the operating budget within the boundaries of the gross profit margin.
(2) Our projection, so far, shows that the current estimates for sales and cost of goods sold resulted in a higher gross profit margin of $8,439 compared to that of 2010’s $7,492.
(3) To project the operating costs for 2011, maintaining the operating expenses within the amount of the 2010 historical operating costs will result in a likely chance of realizing a minimal income.
(4) Going beyond the historical costs would result in another break-even year or even a possible net loss.
(5) To drive our point, we will be using the 2010 amounts of operating expenses for our 2011 projections.
(6) Post the individual operating expenses to cells J29 through J37.
.
Net Income/ (Loss)
The entire 2011 projections will result in the realization of a minimal income. The amount in cell J41 was, again, automatically generated by deducting the value of cell J39 from J24.
For your own business projections, continue with the 2012 to 2014 by basing your next plans of action on the outcomes. However, evaluate the results of the projected income and expenses for 2011 and the years thereafter before doing so. Read the summary about our analysis and suggestions for our business example.
Summary:
The main problem in our business example is the large amount of slow-moving stock inventory. This is often the pitfall of small-scale entrepreneurs as they are enticed by suppliers and dealers into stocking up on goods without first testing their viability in the business market and location.
However, the business owner will not realize the effects of the non-moving merchandise if he does not make future projections using an Excel pro forma income statement. In our example, the business owner will come to realize that he cannot hope for some notable improvement in next year’s operations because the business is still saddled with poor- to-moderately performing goods. Money remains tied up in those goods; hence the owner will be constrained to sell them at discounted prices, if only to recover their costs.
In the meantime, the entrepreneur may also consider infusing more capital funds in order to stock up on fast-selling items. This time, however, there should be a careful estimate on the quantity and the rate of turnover.
In using this Excel pro forma income statement for future projections, the results can readily show if you can afford to sell on credit or not. Some entrepreneurs think of credit sales as a good marketing move, but without totally evaluating their earning capacity and what makes up their resources. Future projections may only be guesses, but they are often based on real premises.
Reference Materials and Image Credits:
References
- Author cscantoria’s personal accounting files
Image Credit:
- FEMA writer Michael Osborne interviews Nashville business owner Murph Wanca, who received a Small Business Administration (SBA) loan…
- Sample Income Statement created by author cscantoria for this article.
This post is part of the series: Income Statements
Find tips on how to prepare, read and analyze income statements along with examples and free templates you can download for personal or business use.


