Three major Business Process Analysis methods include Process Flow Diagram, Myers’ Rigorous Physical Diagram, and Timing Analysis.
Davenport & Short (1990) defines business process as “a set of logically related tasks performed to achieve a defined business outcome.” The three elements of a process are entities, objects, and activities. Processes take place between entities by manipulating objects through activities.
Business Process Analysis highlights the impact of a specific process or function on the other processes or functions of the business. It establishes a baseline on how things work and help generate quick fixes for problems, remove bottlenecks, improve processes , and improve overall effectiveness and profitability of the business.
Process Flow Diagram
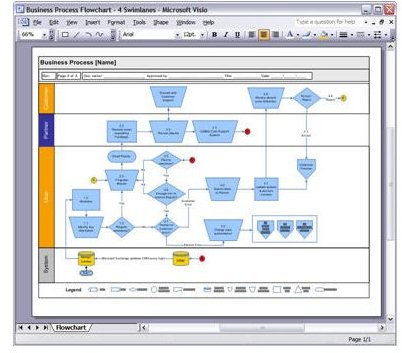
The process flow diagram illustrates the process as a flow chart. Graphic elements such as rectangles represent tasks, arrows represent flows such as information, inverted triangle represents storage or inventory, and circles represent storage of information. The entry and exit points of inputs and outputs define the boundaries of the process to complete tasks.
The process flow diagram help determine process capacity, flow rate, capacity utilization, lead time, idle time and set up time. Identification of the bottleneck or the slowest task provides an opportunity to increase capacity. The process flow also helps determine whether starvation or blocking of a process occurs and help iron out such process flaws. For instance, the quality analysis team might remain idle due to lack of output from the data entry team. The flow diagram help determine the best alternative to overcome such starvation by considering whether changing the position of quality analysis in the flow diagram helps remove such starvation.
A major drawback of the process flow diagram is that it represents the way the process actually it, and not the way it ideally should be. For instance, employees might not disclose rework loops or other potentially embarrassing and illogical aspects of the process. The possibility of some important component deemed insignificant left out alters the equations in a big way.
Process Flow Diagrams take many forms. A popular type is the the Gap Analysis Flow Chart that help determine the extent to which the processes fulfill strategic objectives of the enterprise.
Image Credit: flickr.com/Ivan Walsh
Myers’ Rigorous Physical Diagram
Myers rigorous physical diagram is a Business Process Analysis methodology that traces the flow and exchange of data and physical material movements among various units within an organization.
The diagram consists of circles and arrows. Circles denote a unit or department, and labeled arrows to other circles indicate the flow of data or information.
For instance, an arrow between the “customer circle” and “sales circle” denotes a customer placing an order. The sales team placing a shop order request to fulfill the order leads to another arrow from the “sales” circle to the “manufacturing” circle. “Sales” might also inform finance and accounting, planning section and the like, all leading to more arrows.
The graphical representation of the flow of events helps smooth out process flows. For instance, the diagram might indicate the finance department directly sending an invoice to the customer, oblivious to whether the customer has made some last minute changes. A possible rectification is by routing the invoice via the sales unit, and making the sales unit the sole interface with the customer.
The Myer’s Rigorous Physical diagram is however simplistic in nature, and does not consider the time taken to complete a process.
Timing Analysis
Timing Analysis is another Business Process Analysis method that includes the dimension of time. It bases itself on a sequential flow chart of the process with the time taken for the completion of each event. Most problems occur due to time anomalies or clashes, and most such time constraints invariably come from other processes.
Understanding factors such as the minimum and maximum duration of each process, the earliest and the latest time the input needs to arrive, and the earliest and latest time the output becomes available help iron out such time-based anomalies.
For instance, timing analysis might identify the dispatching unit remaining idle for the better part of the day and facing a heavy workload toward the end of the day. Timing analysis of the interlinked processes might help identify was to streamline the processes so that the dispatch section gets an even workflow throughout the day.
Two related project management specific methodologies that find application in business process analysis to improve process flows is Program Evaluation and Review Technique (PERT) and Critical Path Method. PERT help differentiate between events and activities and estimate the time between events. The Critical Path Method charts paths between tasks that rely on completion of previous tasks, and analyze the time required to complete a task.
References
- Davenport, T.H. & Short, J.E. (1990 Summer). “The New Industrial Engineering: Information Technology and Business Process Redesign,” Sloan Management Review.
- Selected Busienss Process Analysis Techniques. retrieved from https://www.requirementssolutions.com/Analyze _Business_Process.html


