Find out where all your traffic is coming from, in one report. This report will help you compare the ways in which your website gains traffic, so you may make adjustments where you see necessary to aid your site growth.
The Google All Traffic Sources Report combines the information in the Referring Sites Report and the Search Engine Report. This way, you can see all the traffic sources in one place to make your comparisons and analyze your data.
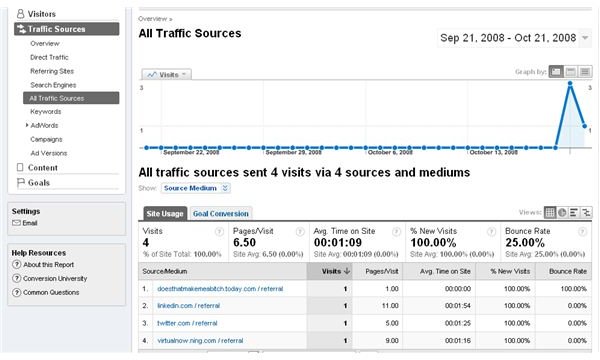
To get to the All Traffic Sources report, all you need to do is login to your Google Analytics Dashboard, click Traffic Sources, and click All Traffic Sources. Now you will see a screen that looks like this:
You’ll see a graph with all of your visits, followed by a list of all the sites that brought traffic into yours. Each one of the items on this list will be presented as a clickable link where you will be able to get more detailed information regarding the specific referral.
Both the overall report and the more specific report for each referral will provide you with the following information:
- Visits: The total number of times your site has been visited throughout the day.
- Pages per Visit: The total number of pages looked at during each visit.
- Average Time on Site: The amount of time each visitor spent looking at your site.
- Percentage New Visits: The number out of the total visits considered new visitors who had never been to your site before.
- Bounce Rate: The percentage of visits which clicked back off of your site to go to something else quickly after landing on your page, likely because they did not mean to go to your site, or did not find what they needed.
This, like other reports, may be graphed by the day, week, or month using the icons in the top right of the area above where the statistics are shown, below the graph. You may also adjust your time line by clicking the arrow next to the date range (typically a month) to get a better view of a specific week, or day.
This report will help you get a broad look at where all your traffic is coming from before you dig into other reports to see how well each specific type—direct and search engine—is doing. You will be able to look at this report to see where you need to spend more time. These reports will help you see how your social media and other campaigns are doing so you can make adjustments where needed so as to improve the overall traffic to your site.
This post is part of the series: Learn More About Your Website Traffic with Google Analytics
Learn all about the sources of your web traffic so you can find out what works and what doesn’t. This will help you decide what to do with your advertising budget.
- Learn More about Your Website Traffic Statistics
- Google Analytics Reports: Direct Traffic
- Google Analytics Reports: Referring Sites
- Google Analytics Reports: Search Engines
- Google Analytics Reports: All Traffic Sources
- Google Analytics Reports: Keywords
- Google Analytics Reports: Ad Versions
- Google Analytics Reports: Campaigns