One of the basic tools for quality control, histograms are charts that display the frequencies Histograms are easy to make when using Microsoft Excel as long as you have the Microsoft Analysis ToolPak is installed. Here you will learn to make an histogram on Microsoft Excel.
Getting Started
Before you get started, you need to make sure that you have the Microsoft Analysis ToolPak in Excel. If you do not have it installed, it is conveniently accessible free from the Microsoft web site. If you have Microsoft Office Excel 2007, you can tell if you have the Analysis ToolPak installed by clicking the Office button and then the Excel Options link. In the Excel Options window, click Add-ins on the left. On the Add-Ins panel, select Excel Add ins from the combo box and click the Go button. In the Add-Ins window, see if Analysis ToolPak is checked. If it is checked, you are ready to go.
Histogram Demonstration
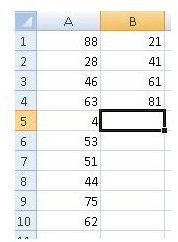
To demonstrate how to make an histogram on Microsoft Exce l , enter some sample data in a worksheet. Open Microsoft Excel and type in the following data into a black sheet:
A1: 88, B1: 21, A2: 28, B2: 41, A3: 46, B3: 61, A4: 63, B4: 81, A5: 4, B5: Blank, A6: 53, B6: Blank, A7: 21, B7:Blank, A8: 44, B8: Blank, A9: 75, B9: Blank, A10: 62, B10: Blank.
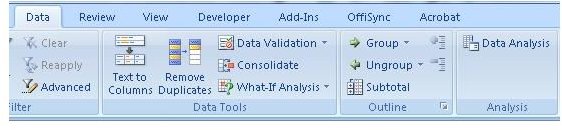
Once your sample data is entered, click the Data tab on the ribbon and then click the Data Analysis icon in the Analysis group.
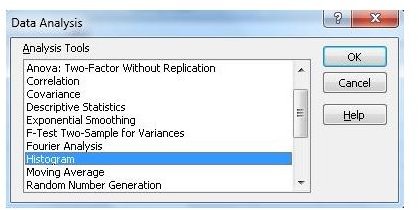
In the Data Analysis window, click Histogram and then click the OK button.
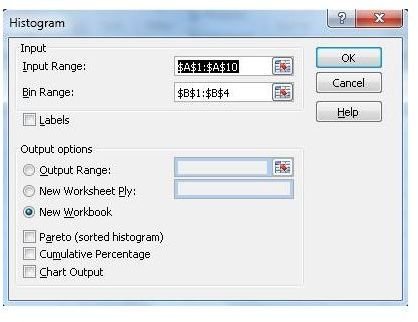
You will see the Histogram window containing important options that are needed to make an histogram on Microsoft Excel. In the Histogram window, enter A1:A10 in the Input Range field. In the Bin field, enter B1:B4. In the Output Options section, choose the New Workbook option. Check the Chart Output box if you want to have an embedded chart in the new workbook. Click the OK button.
You will see a new workbook created that displays the histogram in a table. You can now interpret your histogram’s data .
This histogram counts the number of values in the sample data that fall into each bin. For example, there are three values that fall in the range of 62 to 81: 62, 63, and 75.
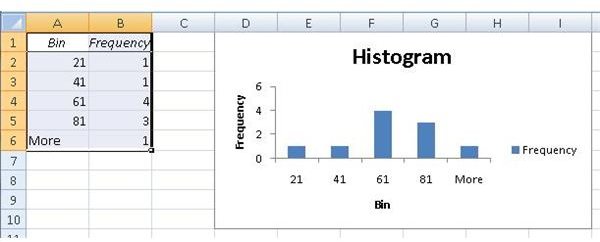
Microsoft counts data points by looking at the lowest bound and the Bin value. For example, the first bin, “21,” includes values from zero up to and including 21. The only data point in that bin is “4” so the value for that bin in the histogram is “1.”
As a final note, the reason we selected the “New Workbook” option for this histogram is because when, choosing the “New Worksheet” option, the worksheet created in your existing workbook will not include the chart even if you choose the chart option from the “Histogram” window. This is a limitation of Microsoft Excel, and not of this histogram tutorial.
You now know how to make an histogram on Microsoft Excel. Although the process is fairly simple, real life applications usually involve more data points and bins.


