If you need to perform complex analyses of your data, MS Excel offers a toolpak that will help you do the job. Learn how to load and use data analysis in Excel.
Load the Data Analysis ToolPak
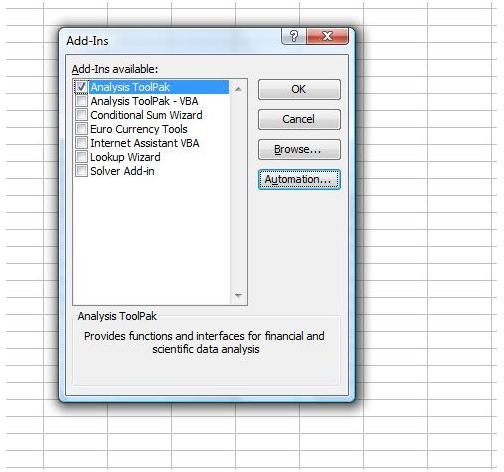
If you are wondering how to use data analysis in MS Excel and before you can use it, you need to load the Analysis ToolPak. In Excel 2003 or earlier, go to the Tools menu and select Add-Ins. Select Analysis ToolPak and click OK. If Analysis ToolPak is not listed in the Add-Ins list, click Browse to locate it. If Excel notifies you that the Analysis ToolPak is not yet installed, click Yes to install it. After loading it, you will find Data Analysis on the Tools menu.
In MS Excel 2007, click the Office Button and select Excel Options. Click on Add-Ins, select Excel Add-Ins in the Manage box and click Go. Select Analysis ToolPak and click OK. If Analysis ToolPak is not listed in the Add-Ins list, click Browse to locate it. If Excel notifies you that the Analysis ToolPak is not yet installed, click Yes to install it. After loading it, you will find Data Analysis on the Data tab.
Use Anova Data Analysis Tools in Excel
The first three data analsis tools listed in the Analysis ToolPak are Anova analysis tools. Anova stands for ANalysis Of VAriance. To use the correct Anova analysis tool depends on the number of factors and samples you want to test. Anova: Single Factor provides simple data analysis of variance on at least two factors, while Anova:Two-Factor with Replication can be helpful if the data you are analyzing can be categorized along two different aspects. Anova: Two-Factor Without Replication is a data analysis tool that also provides analysis on data that can be categorized along two different aspects, but with only a single obervation.
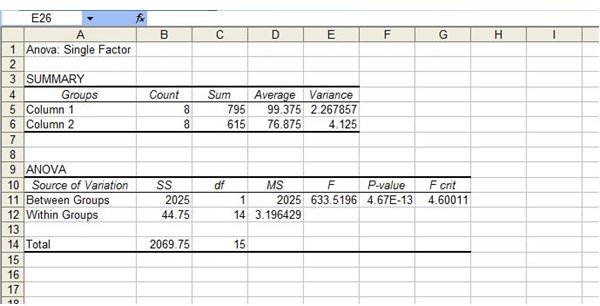
To use an Anova data analysis tool, go to the Data tab in Excel 2007 or the Tools menu in Excel 2003 and select Data Analysis. Select the tool you want to use. Select the Input Range you want to analyze, whether the data is grouped by columns or rows and whether there are labels in the first rows. Select an Output Range or a new worksheet and click OK.
Correlation and Covariance Data Analysis
Correlation and Covariance data analysis tools both measure to what extent variables mutually differ. The Correlation tool analyzes data independent of any units of measurement being used, while Covariance does factor in such units. These data analysis tools can help you determine whether two variables have the tendency to move together.
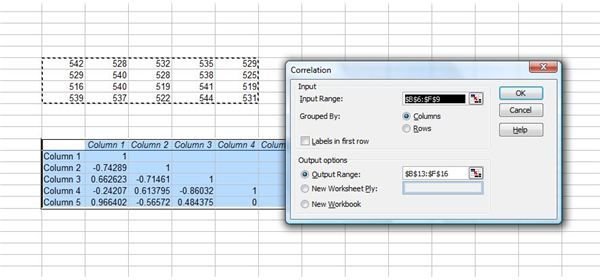
To use one of these data analysis tools in Excel, go to the Data tab in Excel 2007 or the Tools menu in Excel 2003 and select Data Analysis. Select Correlation or Covariance. Select the Input Range you want to analyze, whether the data is grouped by columns or rows and whether there are labels in the first rows. Select an Output Range or a new worksheet and click OK.
Other Data Analysis Tools in Excel
There are many other data analysis tools you can use in Excel. Descriptive Statistics will generate a report analyzing variabilities and central tendencies of data. Exponential Smoothing is an Excel data analysis tool used for forecasting. F-Test Two-Sample for Variances compares the population variances of data. Fourier Analysis analyzes periodic data.
Histograms analyze data based on individual and collective frequencies . Read Understanding Histograms to learn more about this data analysis tool and how to use it in Excel. You can use data analysis tools in Excel such as Moving Averages to project values in a forecast period. Check out Moving Averages: Exponentially Weighted for a detailed tutorial. Learn more about how to use data analyses in Excel in the Bright Hub articles Excel Statistical Analysis Formulas: F-Test, Rank and Percentile and Microsoft Excel: Build a Model to Predict Sales Based On Multiple Regression .