One of the most attractive options within Excel is its ability to generate visually striking charts from data at the press of a button. However, some of the most attractive charts can provide a misleading representations of the data. It’s time to choose substance over style.
Charting in Excel
Excel’s charting functions are some of the most attractive features. However, they can be seductive and lead the user into creating charts which look very attractive but actually can mislead or fail to communicate. The best way to see this is to consider a practical example.
Excel Charts: Style or Substance?
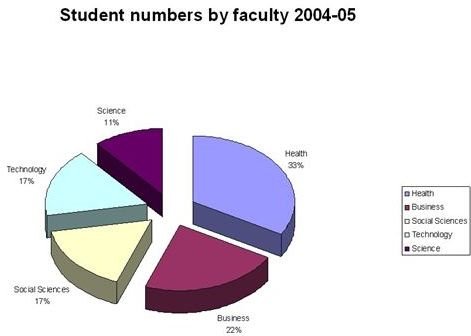
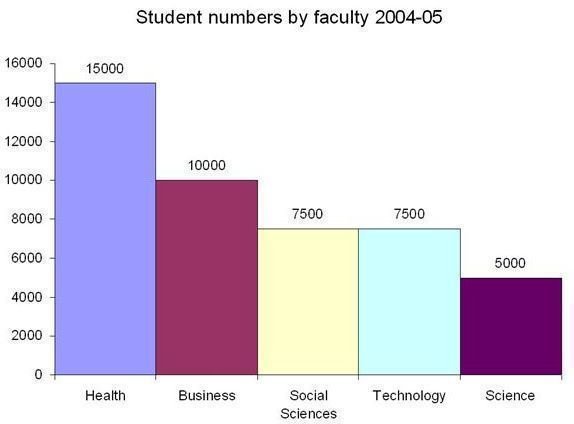
Consider these two charts.
Look at the chart on the left. Pie charts are not a very good idea at all. There is research evidence to show that we find it difficult to perceive proportion when displayed around a circle. In this case, splitting up the pie, making it 3-D and adding a 45 degree viewing angle renders it almost impossible to see what is happening
To these problems, we may add font sizes generated automatically by the computer within the spreadsheet that become far too small when copied and pasted into a slide or report. The version on the right is much clearer if a little less glamorous!
Now look at the next pair of charts.
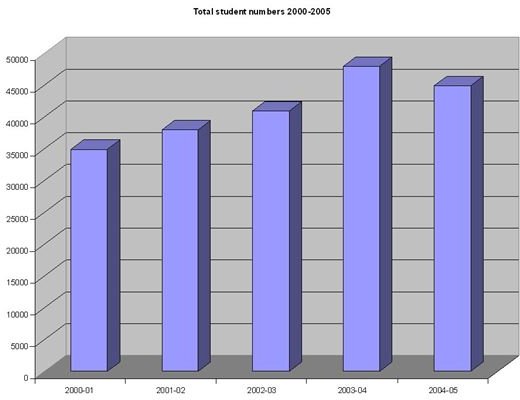
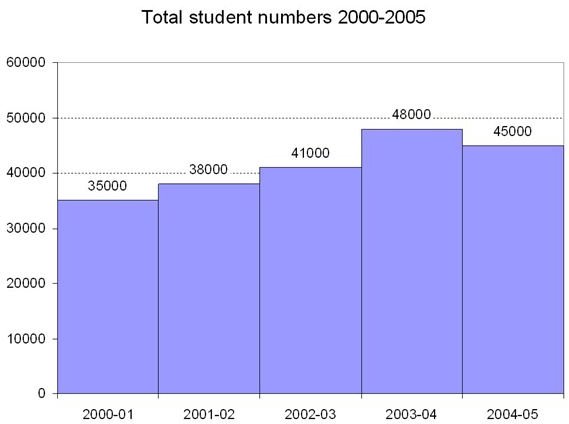
Spreadsheet graphics applications have encouraged us to use 3-dimensional charts. In the bar chart on the left, the three dimensional effect simply adds a degree of uncertainty as to where the top of the bar actually is. The background adds to the uncertainty, as do the gaps between the bars. Add to this, the problems of the previous chart in terms of inappropriate font sizes generated automatically, and the result may be best described as “suboptimal”. The version on the right is less immediately appealing but again communicates more clearly.
Finally, in case you thought it couldn’t get any worse, here’s my attempt at the worst possible representation of this data:
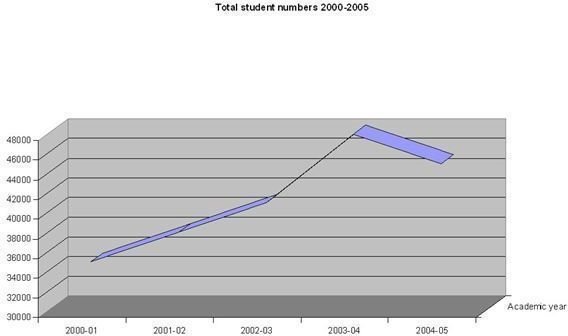
In addition to the problems raised with the first two charts, which this chart shares, we may add two further problems. One is the use of a false origin at 30000, which exaggerates the differences, and the second is the plotting of a trend based on discrete data. Students do not join the University continuously but at the start of a year, or in a few cases, a semester, therefore plotting a trend is misleading.
Tips For Charts That Communicate Effectively And Honestly
If you want charts that communicate clearly, then try following these tips:
- Avoid pie charts.
- Display in two dimensions, not three.
- Don’t use a line graph to display discrete data.
- Make sure that font sizes are big enough to be visible, don’t rely on Excel to get this right automatically.
- Use a true origin, or if not ensure that the false origin is clearly labelled and explained.
For more tips and tricks, be sure to browse through the other Excel chart tutorials found here on Bright Hub’s Windows Channel.


