
This Excel tutorial will describe how to save a current chart as a template, so that you can create charts with the same formatting and design at a later date with just a couple of clicks.
Saving Special Chart Formats and Designs
Even though there are quite a number of pre-designed chart and graph formats in Excel 2007, chances are that you’ll have your own particular layout that you use often. Instead of recreating this design each time you go to make a new chart in Excel, you can save it as a chart template. This way, you can save a lot of time by using this template in almost the same manner you would insert a standard Excel chart. Here, we’ll describe how to save a new chart template and how to apply this template to create a chart from raw data.
How to Create a Chart Template?
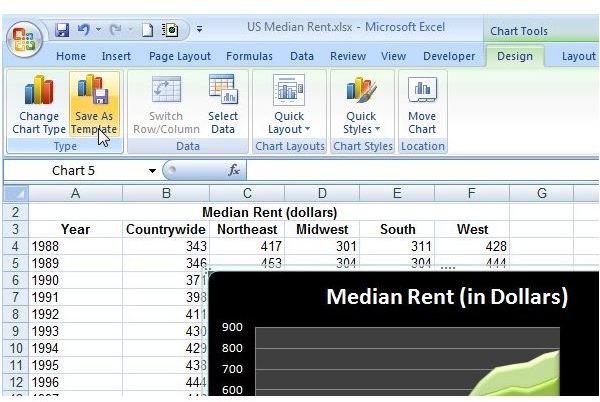
Step 1: Begin by designing your chart as normal. As an example we’ll use an area chart that we created in a previous tutorial . A screen shot of this chart is shown below. (Click any image for a larger view.)
Step 2: Make sure that the chart is selected in the Excel spreadsheet and then go to the Design tab under Chart Tools on the Excel ribbon. (Note that this tab only shows up on the ribbon if the chart is selected.) Click on the Save As Template button.
Step 3: Now, the Save Chart Template dialog box should appear on your screen. Navigate to the directory where you want to save the template and enter a file name. Make sure that the option Chart Template Files (*.crtx) is chosen as the Save as type.
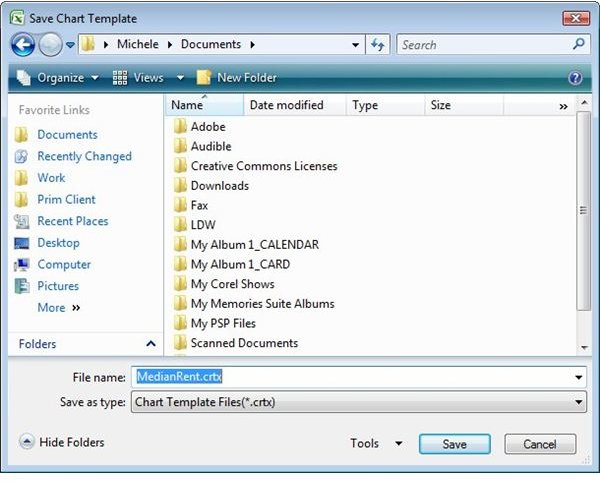
Step 4: Click Save and the new chart template will be created and you’ll be returned to the main Excel spreadsheet.
Using a Saved Chart Template
Once you have the template saved, you can use it to insert a new chart into an Excel spreadsheet in almost the same manner that you would insert any other chart.
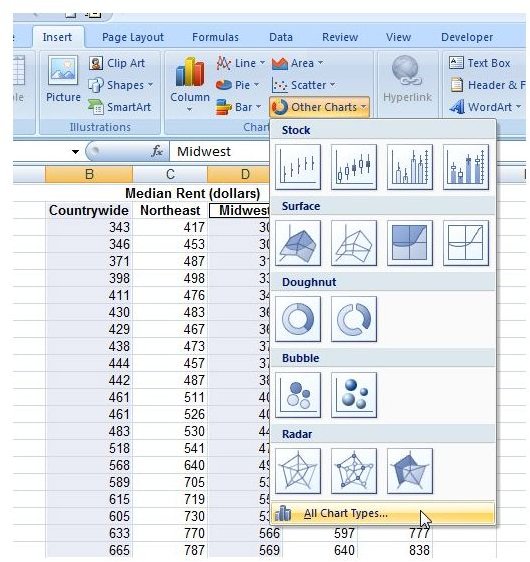
Step 1: Select the data in your worksheet that you want to use to create the new chart.
Step 2: Go to the Insert tab on the Excel ribbon and click Other Charts. When the drop down box for this option opens, select All Chart Types.
Step 3: When the Insert Chart window appears, click on the Templates folder. All of your saved chart templates will appear.
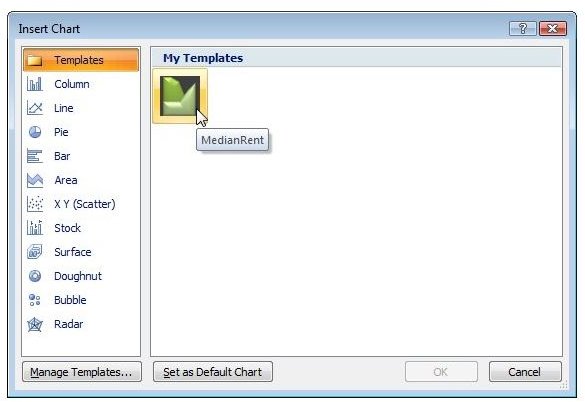
Select the one that you wish to use and click OK. The new chart will appear in your open workbook, ready for further modifications, if needed.
For more tips and tricks, be sure to browse through the other items in Bright Hub’s collection of Excel chart tutorials . New and updated materials are added on a regular basis, so bookmark us and check back often.


