In this Excel tutorial, we’ll show how the What-If Analysis feature can be used to create alternate scenarios in a spreadsheet or workbook.
What-If Scenarios
When you’re working in an Excel spreadsheet that contains a number of formulas, one little modification can change the final results quite a bit. However, if you’re preparing a budget or planning report, it can sometimes be nice to see just exactly how much these numbers will change if a tiny tweak is made here or there. Instead of creating a whole new workbook or risking the integrity of an existing one, you can use Excel’s What-If Analysis feature to create alternate scenarios.
Accessing the What-If Analysis Feature
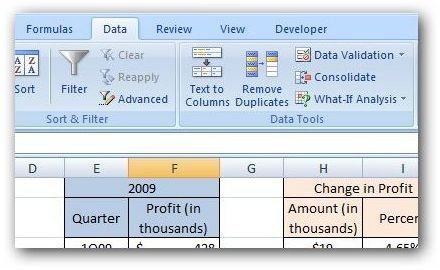
In Excel 2007, the What-If Analysis tool can be found on the Data tab of the Excel ribbon as shown in the screenshot below. (Click any image for a larger view.)
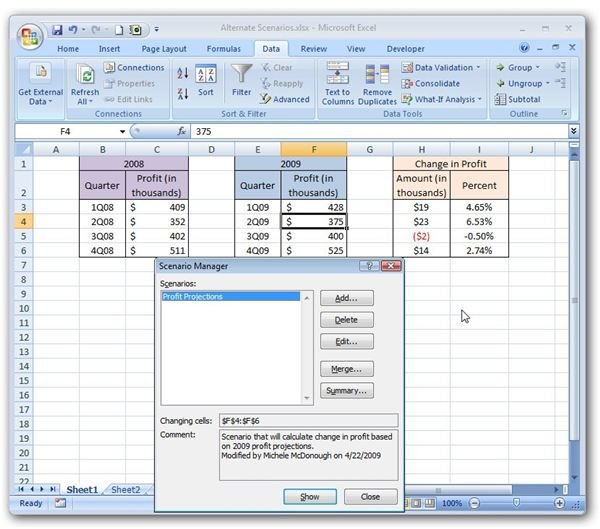
To demonstrate how this feature is used, we’ll look at an example within a spreadsheet that compares quarterly profits from last year to the current time period.
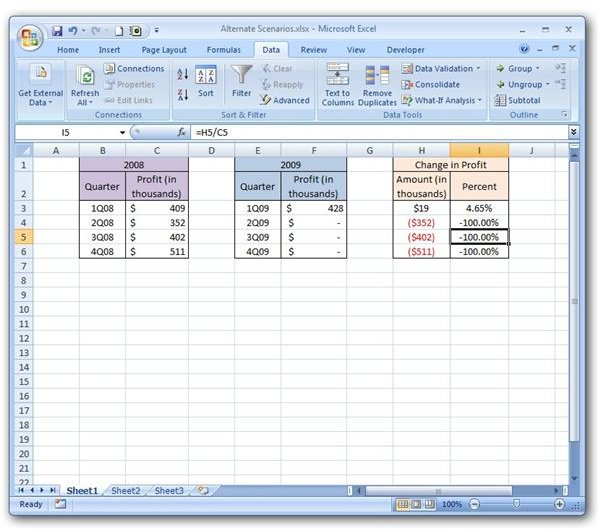
In this demonstration, we have three tables. The first table gives profits by quarter for 2008. The second table has been prepared to give the same information for 2009. The third and final table has been constructed to give a brief analysis of this data and includes formulas that will compute the change in quarterly profits from one year to the next in terms of both actual dollars and percentage increase or decrease.
Scenario Manager
In this example, we’d like to construct an alternate scenario based on projected profits for 2009. That is, we’d like to enter values for each of the fields in the second table and see how these numbers would affect the quarterly change information described in the third table.
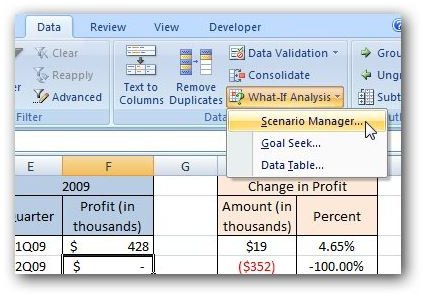
To begin, first go to the Data tab on the Excel ribbon. Click on the arrow next to What-If Analysis and select Scenario Manager.
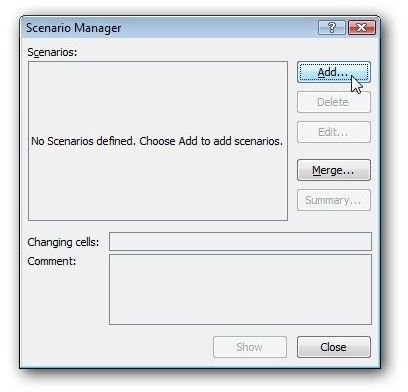
When the Scenario Manager window appears, click the Add button.
This will bring up the Edit Scenario dialog box. Here, give a name for the scenario that you wish to create and designate which cell or group of cells you plan to change. (Note that you can click on the cell selection icon to the far right of the Changing cells field in order to select the cells with your mouse in the current worksheet.) Although optional, you can also provide a short description of the scenario in the Comment field to indicate the purpose of this What-If Analysis. Click OK to continue.
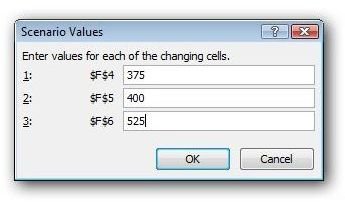
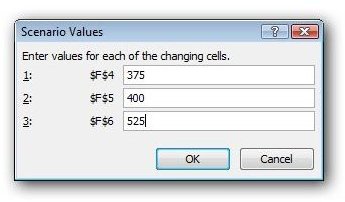
Next, the Scenario Values window will appear. Enter the projected numbers for each cell and click OK.
This action will return you to the Scenario Manager. Make sure the appropriate scenario is selected and click Show.
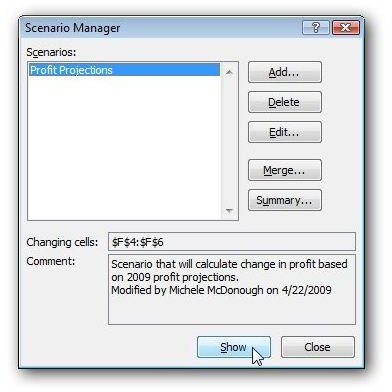
After clicking Show, the information related to that scenario will be updated and calculated in the spreadsheet. However, note that the Scenario Manager window will remain open. This way, you can cycle through a number of alternate scenarios without having to access the feature over and over again.
When you are done investigating these what-if situations, click the Close button to exit the Scenario Manager. When closing this window, that last scenario chosen will be shown in the worksheet, by default. To return to the original unaltered state of the spreadsheet, just click the Undo button.
Additional Resources: For more tips and tricks, be sure to browse through the other items in Bright Hub’s collection of Excel tutorials. Learn about Excel functions , discover more tools for constructing charts and graphs , and more. Additional user guides are being added on a regular basis so check back often.


