From the FTEST to RANK and Percentile, Excel now has a set of tools that can make these calculations so much easier on you. Learn what these tools can do and how Excel can easily calculate these functions for you.
Running Your Analysis
In the previous article in this series, several of the tools of the Analysis ToolPak were overviewed. This article continues that breakdown of the available tools for statistical data analysis in Excel.
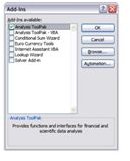
Before you begin using the tools, you will need to install the Analysis Toolpak if you do not have it in your version of Excel. To download the software, follow these instructions.
- Open Excel.
- Go to Tools -> Add-Ins.
- Check the box next to Analysis Toolpak.
- Click OK, and the tool will install automatically.
Once you have the tool pack installed, you can begin running any statistical data analysis within the Analysis ToolPak. To run any test using the Data Analysis ToolPak, follow these steps.
- Go to Tools -> Data Analysis.
- Click the tool that you want to use.
- Click OK.
- Select the options that you want to use in the dialog box for your selected tool.
F-Test Two-Sample for Variances and Fourier Analysis
This tool basically does what it says; it compares a set of population variances by conducting a two-sample F-test. You will need a hypothesis if you plan on conducting an F-test.
This is the formula for an F-TEST in Excel: FTEST(array1,array2) where array1 is your first range of data and array2 is your second.
Fourier Analysis
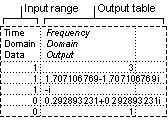
The Fourier Analysis tool helps you with problem solving when you are working in linear systems and does analysis on periodic data. It does this by using the Fast Fourier Transform method. You can also do inverse transformation equations with this tool as well.
Histogram and Moving Average
Histogram
With this tool, you can create data based on the frequency (individual or cumulative) for cell range. This is an easy way to find the mode of a set of values.
Moving Average
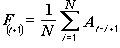
If you are looking for trends or patterns in information, use the Moving Average analysis tool. It is especially useful in forecasting sales or when calculating inventory for a company.
To use this tool to forecast inventory, use the below steps.
- Go to Tools -> Data Analysis.
- Select Moving Average, and click OK.
- Input either a row or column of data in the Input Range.
- Input the number of values that you need to include in the Interval box.
- Add which cell you would like your information to output to in the Output Range box.
- Check Chart Output. This will compare and contrast the current and forecasted inventory amounts.
- Click OK.
Random Number Generation and Rank and Percentile
Random Number Generation
This data analysis function will fill a range of cells with random numbers that have been pulled from one of several distribution points. This allows you to describe subjects of a population with a probability distribution. If you are simply interested in random number generation, Microsoft has a special add-in for Excel Random Number Generator (currently $24.95 online).
Rank and Percentile
This data analysis tool will produce a table that has the ordinal and percentage rank of each value within a set of data. You will use the RANK and PERCENTRANK worksheet functions when you run this tool. You can use the percentile information to what value has scored high enough to be acceptable. For example, you can use this to find student standing within a school.
The formula for this function in Excel is PERCENTILE(array,k), where array is the range of data the defines the subject’s relative standing and k is the percentile value of the inclusive range 0..1.
For more information on using Excel for calculations, read Tricia Goss’s article Using Data Validation to Make a Dropdown List in Excel.
This post is part of the series: Data Analysis ToolPak
Got a lot of data to deal with? Well, Excel has just improved your life with the Analysis ToolPak. These software tools allow you to easily and quickly compute and output statistical data analysis and engineering analysis functions.


