The frequency function in Microsoft Excel provides a special way to count items that fall within in a specified range. In this segment, we’ll show how the frequency function can be used to group items into intervals as a means to better organize your data.
The Frequency Function
Although similar to the count function available in Microsoft Excel, the frequency function can be used in a broader range of applications. In this article, we will be using the frequency function to organize raw data into incremental groups that can later be displayed in histogram format.
The example used in this series was defined and discussed more thoroughly in Part 1 of this series. Take a look at that article for more background information. Also, an Excel workbook containing the data and tables used here has been uploaded to the Windows Platform Media Gallery . Feel free to download that file and use it as a reference or as a starting point for your own calculations.
Calculating the Frequency
In our example from Part 1 of this series, we entered raw data taken from a seed collection experiment into an Excel spreadsheet. We could just calculate the frequency for each individual seed count in our example, but most times it is better to group the data into appropriate intervals. In this example, all of our values are between 2 and 38, so one grouping possibility is to break up the data where the intervals consist of seed counts between 0 and 5, 6 and 10, and so forth.
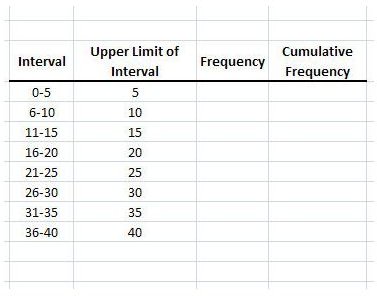
We’ll start creating a new table in Excel to hold this information. To begin, we’ll create columns for the Interval, Upper Limit of the Interval, Frequency, and Cumulative Frequency. Before entering any formulas, we’ll manually input the information for the interval length and upper limit of the interval into the table. (Click the image for a larger view.)
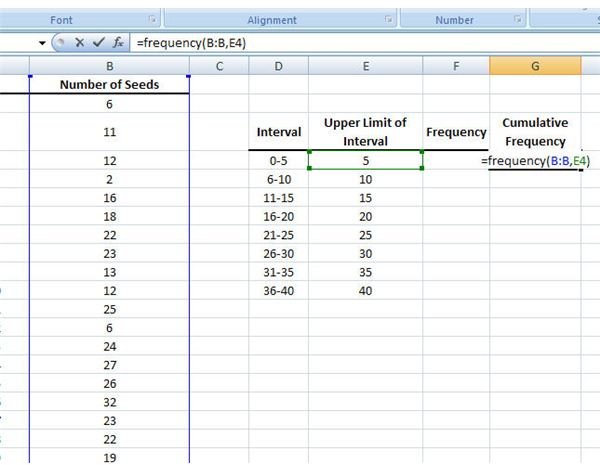
Next, although this may seem a little backward, we’ll construct a formula to calculate the cumulative frequency of each interval. Go to the first cell in the Cumulative Frequency column of your table. In our example, this would be cell G4. Enter the formula:
=frequency(B:B, E4)
In this formula, the range B:B denotes the column that contains all of the seed count values. If the data in your spreadsheet is in a different column, make the appropriate substitutions. The second item, E4, in our formula specifies the upper limit of the interval for which we are calculating the cumulative frequency.
This formula will scan through the values in our data column and count the number of items that are less than or equal to the upper limit of the interval.
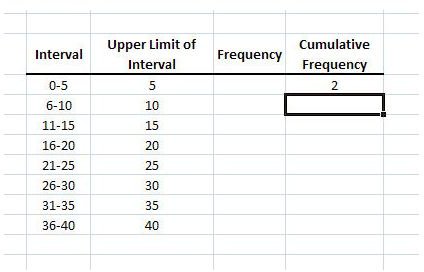
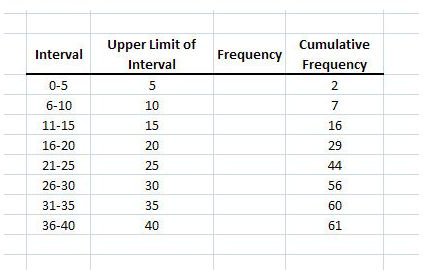
Next, copy the frequency formula from the cell and paste it into the other cells in the Cumulative Frequency Column.
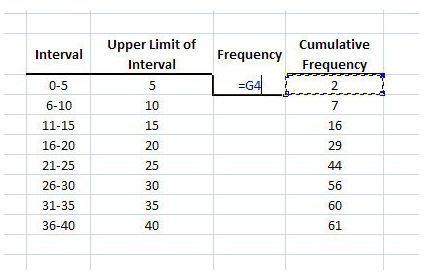
Now, we want to use the results from the cumulative frequency values to calculate the frequency for each interval. First, since the frequency and cumulative frequency are the same thing for the first item in the list, enter the following formula into the first cell of the Frequency column:
=G4
The value G4 in this formula denotes the first cell in the Cumulative Frequency column in our example. You may need to modify this in your spreadsheet, depending on where your data is entered.
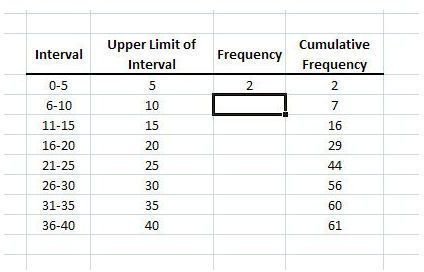
And here’s what the table looks like after entering the formula.
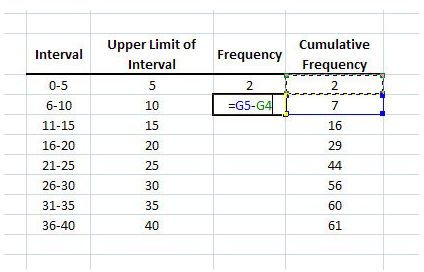
For the rest of the cells, we will calculate the frequency by subtracting the cumulative frequency of the previous interval from the cumulative frequency of the present interval using the formula:
=G5-G4
Again, you may have to make adjustments based on which cells contain the data in your worksheet.
Copy the formula from this cell and paste it into the other cells in the Frequency column.
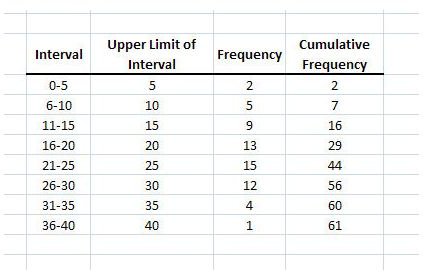
Now that we have this information, we want to transfer it to a histogram. In Part 3 of this series, we’ll cover how to do just that.
This post is part of the series: Histograms in Microsoft Excel 2007
In this series, we’ll cover how to create a histogram in Microsoft Excel 2007. We’ll give some tips for entering your raw data into an Excel spreadsheet, show how to use the frequency function to organize your data, and then demonstrate how to construct and format the histogram from this data.


