The Hertzsprung-Russell Diagram, less awkwardly referred to as the HR diagram, is a powerful tool for putting a star in its place amongst the cosmos, and understanding stellar evolution. However, it can be a little intimidating to interpret at first. Here’s a basic guide.
The Axes
The HR diagram has two axes. The horizontal axis is the spectral class, according to the Harvard Classification scheme , or variously, color or surface temperature. The vertical axis looks at either the luminosity or absolute magnitude of the star, depending on the particular diagram. These values for each axis are all directly correlated to each other, so don’t freak out if one diagram uses luminosity and another uses absolute magnitude!
So, the HR diagram might be better termed a temperature-luminosity diagram, or perhaps a color-magnitude diagram, but then due credit wouldn’t be given to its creators.
There’s a lot that goes into coming up with those coordinates for each individual star, accounting for everything from interstellar reddening to the Doppler Effect and Hubble’s Constant (redshifting or blueshifting.) While any individual star does not particularly matter, it is also important when making an HR diagram for, say, a particular star cluster that these variables are correctly accounted for, lest the entire diagram be shifted in one axis or another.
It is upon this two dimensional space that stars may be plotted, and characteristics of stellar evolution explored.
HR Diagram
Here’s a link to a full size image of the diagram.
Interpreting the HR Diagram: Stellar Evolution
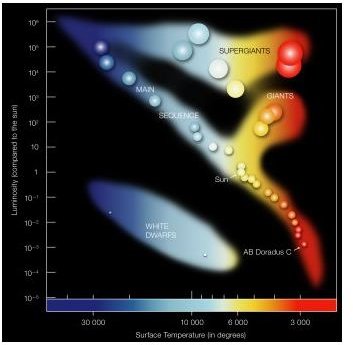
Take a look at the diagram. Upon these axes, the stars appear to have segregated themselves out into groups. Each of these groups of stars may be represented by the Yerkes Classification system (Roman numeral designators verses alphabetic designators for the Harvard classification system). These groups are where stars remain relatively stable over time. Every given mass of star follows a certain path over the course of its lifetime on the HR diagram.
The strip of stars extending from the lower right hand corner to the upper left hand corner is known as the main sequence (V). Where a given star enters the main sequence from its protostar phase is determined by its mass, less mass making a star cooler and dimmer, and more mass hotter and brighter. Along the main sequence, a star’s mass may be easily calculated from these given parameters.
Giant stars, III, are another cluster on the HR diagram, tending to be both moderately cool (G-M) and yet quite bright due to their large surface area. Part of stellar evolution for many main sequence stars includes a venture into this section of the HR diagram, moving vertically through what is known as the asymptotic giant branch. Where this group of stars intersects the main sequence is called the turn off point. When they move back towards the main sequence again having commenced helium burning in their core, this is known as the horizontal branch for population II stars and a red clump for population I stars.
Of hypergiants (0) and supergiants (I), there isn’t too much to see other than a scattering across the top of the HR diagram. That’s because they’re the rarest, but brightest of stars. They may be anywhere from hot blue O stars to cool red M stars. Wolf Rayet stars, for instance, exists a bit to the left of the main sequence strip at the very top, a very hot and very luminous. Luminous blue variables fluctuate horizontally.
The instability strip is an additional feature to the HR diagram, showing where variable stars such as Cepheid variables , W Virginis and RR Lyrae fluctuate with regards to brightness. This occupies a vertical slice from yellow stars.
Going to the lower left hand corner of the diagram, we come upon white dwarfs , VII, usually the product of the collapse of supergiants. These hot yet small and dim stars are the end result of many a main sequence of star, slowly burning out over the millennia.
Annotated HR Diagram
Below is an annotated HR Diagram marking familiar stars along with lifetime and mass information:
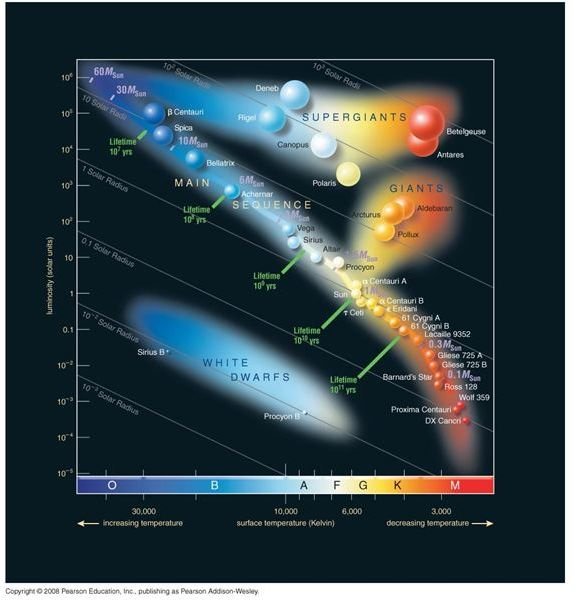
Link to full size image.