Learn about common size financial statement analysis and how investors use it to gauge the earning potentials of a company, and in determining risks involved in making investment decisions. A common size financial statement can be vertical or horizontal; know which type to use through this article.
The Significance of Common Size Financial Statements as Investment and Management Tools
To briefly describe a common size financial statement, it is one where the financial figures are presented in terms of percentages. Each expression of percentage can be used as measure of its proportion to a specific base component of a financial report in a given year. The percentages can also denote the increase or decrease, if comparisons will be made against the data of a previous year. This transforms the income statement and balance sheet reports into convenient tools for analyzing and comparing. Evaluating the present and past performances of a business, will reveal how the results have affected the company’s resources .
Data presented in percentages instead of dollar values, can be instantly reflective of the efficiency or inefficiency in profit generation. The objectives in an analysis of common size financial statements, is to gauge the ability of the entity to generate profit; without considerations for size comparisons between business entities engaged in similar trades.
These objectives can be best attained through the use of two methods by which common size financial statements are presented, the horizontal and vertical methods. Explanations are provided below as your guides, in determining which method will suit your purpose.
Uses and Analysis of Horizontal Common Size Financial Statements
The Horizontal Common Size Income Statement
**
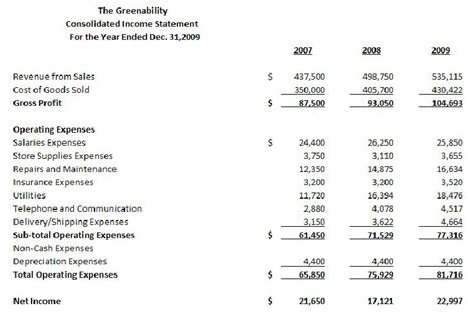
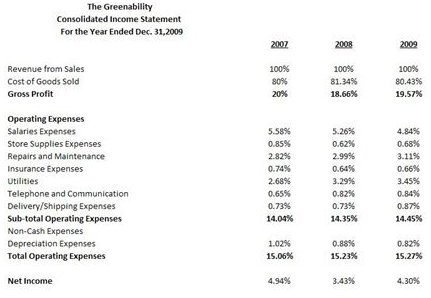
By clicking on the image on your left, you will find an example of a three-year consolidated income statement presentation. We transformed the same financial report into a horizontal common size income statement (left-side image below) by using the financial data in 2007 as the arbitrary year; hence, the percentages for that year were pegged at 100%.
=================================================================
This method is called horizontal, since comparisons will be made horizontally; e.g.:
Net Income of 2008 = $ 17,121 x 100%= 79 % Decrease in Net Income for 2008
Net Income of 2007 = $21,650
======================================================================================
Net Income of 2009 = $ 22,997 x 100%= 106 % Increase in Net Income for 2009
Net Income of 2007 = $21,650
======================================================================================
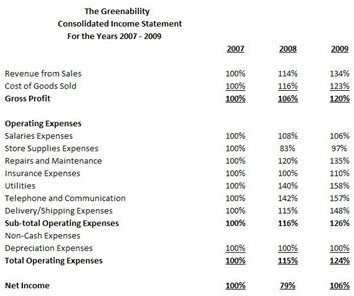
You will note that the percentages in net income for 2008 and 2009 first receded, then exceeded the 100% benchmark of 2007. The financial statement user will read this as a decrease and increase in sales performance.
In our example of consolidated income statement, the sales for 2009 may be impressive at first glance, since it was able to produce net income that exceeded those that were reflected as net income for years 2007 and 2008. However, further analysis of these increases will reveal, that the increment in 2009 represents only a 6% increase if compared to the 100% benchmark net income of 2007.
In 2009, the company barely recovered from the 21% decrease (100% - 79%) in net income of 2008. This could be attributable to the increases in Cost of Goods Sold (COGS) and Operating Expenses (OE), which can be noted as not proportionate to the increase in sales. You will notice that the 34% increase in Sales, had to meet the 23% increase in COGS and the 24% increase in OE. The analysis of common size financial statement in this aspect, can be used to pinpoint areas for cost cutting or re-examining of cost efficiency methods, as well as project the amount of sales to be targeted for year 2010.
Please proceed to the next page for the explanations and illustrations for horizontal common size balance sheet and vertical financial statements.
The Horizontal Common Size Balance Sheet
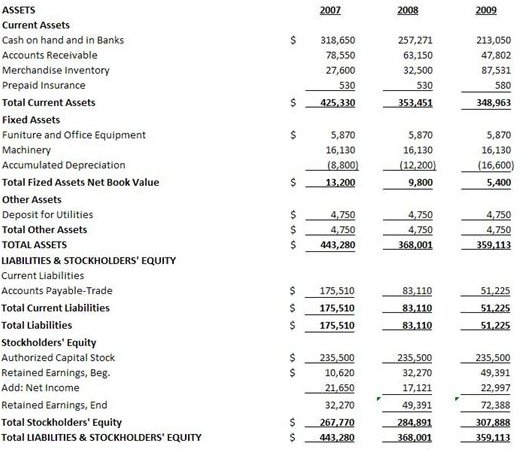
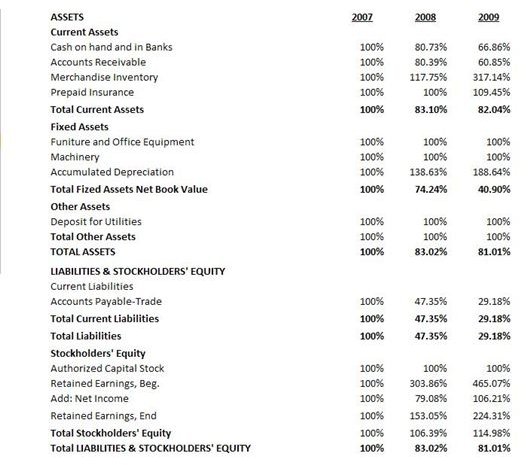
To determine the effects of the erratic sales performance and increases in costs**,** we will be looking at the horizontal balance sheet (please click on the images on your left). From here, we will see that the cash position of the business entity continued to decrease from 2008 to 2009. Cash levels were not maintained anywhere near the 100% benchmark set at 2007. These decreases will of course be related to the increases in cost. In fact, it supports our analysis that the company was not able to generate enough revenues to meet the rising costs.
Management might wonder why their cash position dwindled, despite the increased sales in 2008 and 2009 and the realization of net income, albeit minimal. Take note that Accounts Payable Trade also declined, which means that the business entity’s credit purchases had been limited; hence, procurements were mostly paid in cash. However, it seems that the sales projections for the year were also not met, because a substantial year-end merchandise inventory amount, is still held on hand. Merchandise Inventory increased by 217.14% in 2009, if compared to the 2007 100% benchmark for goods unsold.
Based on our analysis of these common size financial statements, the company was not successful in its sales campaign, which resulted in substantial amount of funds being tied-down in unsold goods at year-end . This likewise shows that the current cash position is only enough to meet current operation levels, while expected revenues that will result from the business operation at this point, is near benchmark level.
Investors may have to think twice before putting their money into the business, since the actual cash balance maintained by the business as of 2009 is only $213,050 while the paid-up capital stocks is $ 235,500. In fact, these are some of the important aspects stock investors look into when investing or divesting
The Uses and Analysis of Vertical Common Size Income Statement
The Uses and Analysis of Vertical Common Size Income Statement
The vertical common size financial statement will make use of vertical comparisons by using a financial statement component as the base. In a vertical common size income statement, the base figure used will be Revenue from Sales within the same year. To illustrate:
Net Income of 2009 = $ 22,997 x 100%= 4.30 % Net Income Generated in proportion to Sales
Sales Revenue 2009 = $535,115
COGS of 2009= $430,422 x 100%= 80.43% COGS in proportion to Sales
Sales for 2009 = $535,115
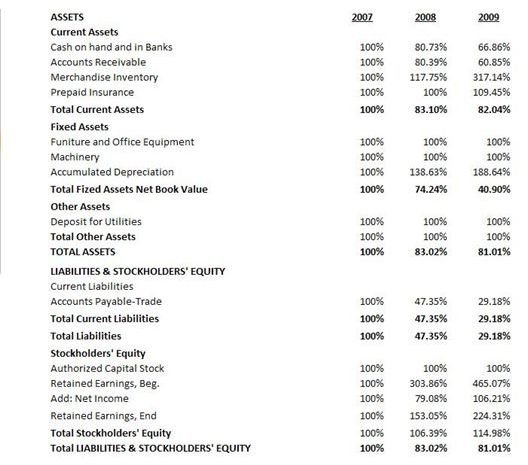
In a vertical common size balance sheet (image on the upper right), the financial statement component used as base is the Total Assets for the same year. Although presented in percentages, the sum of all percentages for each component would also be equivalent to 100% as a way of proving the accuracy of figures computed.
The common size vertical financial statement analysis (lower right image) for this type of presentation is useful when comparing financial data between businesses engaged in similar trades and with more or less the same size in terms of resources or assets. The percentages will represent the proportion of each account to the attainment of its objective or the efficiency by which its assets were used.
In our example, management may want to look at the financial statements of competitors who are performing well, to find out in what aspects their resources as best optimized. This simply means that if our sample business has Total Assets of around $300k to $350k, it would be best to examine the financial statements of an entity with similar figures and engaged in the same trade and find out where their differences lie. On the other hand, comparisons against larger-sized businesses will give you insights, as to what other businesses have or in what areas of financial strategies they focus on, aside from cost-cutting and sales targeting.
There are more information that can be derived through analysis of common size financial statements by comparing each given data, either to a base year or to a base component. Knowledge of different accounting ratios will also give you ideas about the important data to analyze, whether for prospecting or projecting.
Reference Material Credits Section
Reference Material:
- https://financial-education.com/2007/01/31/common-size-balance-sheets/
- https://financial-education.com/2007/01/31/horizontal-common-size-income-statements/
Images:
- Author cscantoria’s files


