The fixed assets to net worth ratio indicates the proportion of a business owner’s cash blocked in capital assets such as brick and mortar instillation, land, factories, and machinery and the proportion of cash available in liquid form to fund the firm’s operations.
Explaining Fixed Asset to Net Worth Ratio
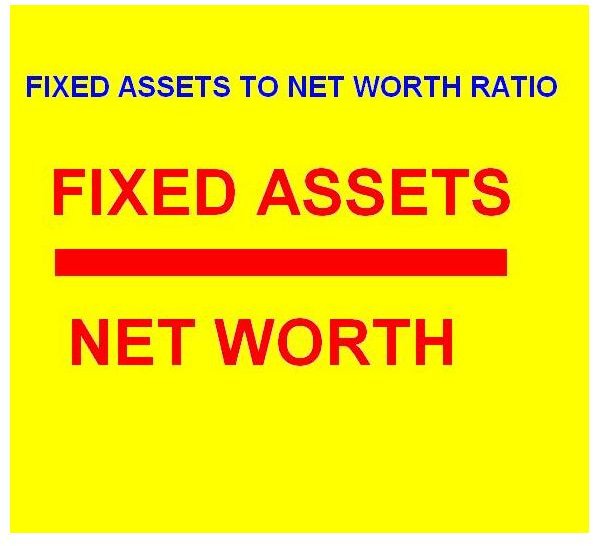
The way to obtain fixed asset to net worth ratio is by dividing fixed assets of a firm by its net worth.
Fixed Assets to Net Worth Ratio = Fixed Assets ÷ Net Worth
Fixed Assets are any long-term, tangible asset held by the firm for business use, and which the firm does not plan to convert to cash in the current or upcoming fiscal years. Common examples of fixed assets include manufacturing equipment, real estate, and furniture. It excludes intangible assets.
The net worth of a firm, also known as owner’s equity or net assets is the total assets minus total liabilities. Both total assets and total liabilities find mention in the balance sheet . The net worth mainly includes all money invested in the firm since inception excluding loans, and the earnings retained during the course of operations, less all liabilities such as outstanding loans.
Image Credit: N Nayab
High & Low Fixed Assets to Net Worth Ratios
The fixed assets to net worth ratio finds widespread application to measure the solvency of a firm. A ratio higher than 0.75 usually reveals the firm is investing high amount in capital excessively as well as non-liquid assets, leaving too little cash to fund operations. This could make the firm vulnerable to unexpected events and changes in business climate.
A high fixed assets to net worth ratio could signal unfavorable profits relative to shareholder investment resultant from poor utilization of plant, equipment, and other production assets. Too little operating profits or even a loss could leave the firm strapped for cash while keeping its fixed assets intact, or tends to draw funds away from working capital to fixed assets, leading to a high ratio.
A very high or a very low fixed assets to net worth ratio weakens the firm’s credit rating for many reasons.
- A high fixed assets to net worth ratio show excessive amount tied up in fixed assets to generate little returns.
- A high ratio reveals inadequate net worth for an otherwise balanced enterprise.
- A low ratio is a warning sign of the firm’s income suffering from servicing high equipment rental or subcontracting costs.
- A low ratio might indicate lack of security to the debt.
Financial ratios are, however, only indicators and do not constitute a complete test of a company’s financial position. The key to making effective use of net worth ratios is comparison to other ratios and considering indeterminables as well as mis-information.
The Optimal Ratio
The optimal fixed assets to net worth ratio depends on the industry and firm-specific circumstances such as the nature of business, sales volumes, extent of utilization of current assets, and the stage of maturity of the current assets.
A good indicator of the optimal net worth ratios for a firm is the median ratio of all firms in the industry for the year, obtainable from trade journals, chamber of commerces, share market research firms, or government statistical departments.
The fixed assets to net worth ratio of a firm could, however, remain distorted owing to certain cash flow reasons. For instance, influx of customer deposits or progress payments with corresponding current liabilities might lead to lower fixed assets to net worth ratio whereas using most of the available cash to acquire a new asset at the end of a financial year might distort the ratio for the year.
Reference
- Credit Management Association Encyclopedia of Credit. Net Worth Ratio. Retrieved from encyclopediaofcredit.com/WebHelp/financial_analysis/net_worth_ratios.htm
- Barry, Miller. (1994, February 1). Cause-and-effect ratio analysis adds decision-making value to credit scoring models. Business Credit. Retrieved from https://www.allbusiness.com/business-finance/business-loans-business-credit/427791-1.html


