The visual representation of your balanced scoreboard should be the highlight of your presentation. Learn how to create a balanced scorecard in Excel with extra features such as converting ratings to symbols.
Formating the Balanced Scorcard in Excel
To get started in creating a colorful presentation for your balanced scorecard in Excel, begin by formatting the title, headers, columns, and rows. The following steps will help you create this sample template in Excel 2003, but you can also make adjustments to the font, color or style to reflect your own preferences.
1. Begin by opening a new workbook in Excel
2. Under File, Page Layout, select Landscape
3. Select the Rows and Columns for the scorecard and under Format set the font to Arial, 12 point, bold, and centered
4. Create a Title for the Scoreboard
- Type the Title in cell A1 without any alignment (center, justified, etc.)
- Select and highlight cells A1 through I1
- Click on the Merge and Center button in the Format toolbar
- Set the font to Arial 18 point bold
- Fill-in the Title cells with a yellow background by selecting Format, Cells and then Patterns and choosing the lightest yellow choice
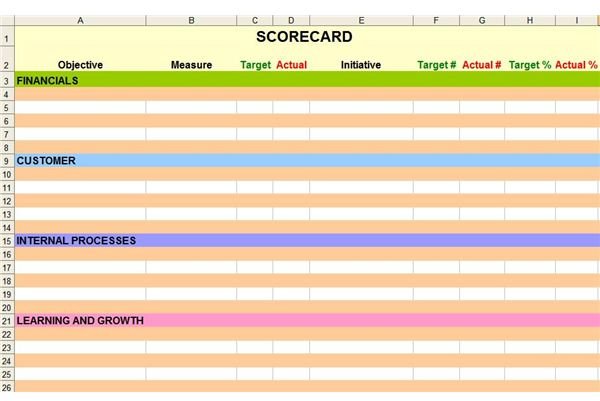
5. Label and Format the Columns
- Label the columns: Objective, Measures, Target, Actual, Initiative Target #, Actual #, Target %, Actual %.
- Fill-in the cells with a yellow background by selecting Format, Cells, Patterns, and choosing the lightest yellow choice.
- Change the font color of the text for Target, Target #, and Target % to Green and Actual, Actual #, and Actual % to Red.
6. Label and Format the Rows
-
Alternate the format of each row (This alternating format will come in automatically even when you add additional rows).
Advertisement- Highlight all the rows to be included in the Scorecard
- Under Format select Conditional Formatting
- Choose “Formula is” under Condition 1
- Type in =MOD(ROW(),2)=0
- Click on Format and choose under Pattern the light orange/tan color
- Click Okay
-
Select and label the four perspectives for the scoreboard by typing and changing the color pattern as follows:
- Financial (Green),
- Customer Satisfaction (Blue)
- Internal Processes (Purple)
- Learning and Growth (Pink)
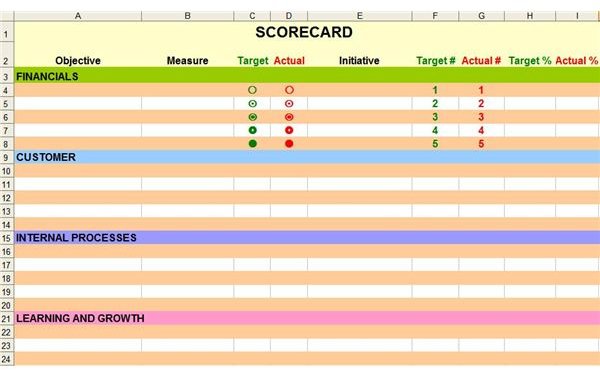
Convert a Numeric Ratings Scale into a Symbol Ratings Scale in the Balanced Scorecard
Now that you have your basic balanced scorecard in Excel template formatted, you can add a great feature that will convert a numeric (1 to 5) performance scale into symbols. To see the transformation:
-
Select in the first cell in the Target column (C4)
-
Under Format, Cell, change the font for the cell from Arial to Wingding 2
Advertisement -
Insert this formula into the cell: =CHOOSE(F4,CHAR(129),CHAR(157),CHAR(158),CHAR(156),CHAR(152))
-
Copy the cell formula to the other data cells in the column by using the copy and drag feature working your way down the C column
Advertisement -
Repeat the steps above to create symbols in the Actual column, except change the cell reference in the formula from F4 to G4.
 Advertisement
Now you can enter 1 through 5 and the scale will be converted to these symbols.
Convert a Percentage Ratings Scale into Symbol Ratings Scale in the Balanced Scorecard
If your raw data is in percentages, you can convert it to the 1-5 numeric scale. For example (5 is above 89, 4 is 89 to 79, etc.) and then use this numeric scale to create a symbol ratings scale as outlined above.
- Select the first Target # data cell (F4) and type in this formula: =IF(H4>89,“5”,IF(H4>79,“4”,IF(H4>69,“3”,IF(H4>59,“2”,“1”))))
- Use the copy and drag feature of Excel to paste the formula into the other cells in the Target # column
- Repeat the steps for Actual # data cell (G4), except change the cell reference in the formula from H4 to I4.
Now when you can type in data from 1-100, it will convert it automatically into the 1-5 scale and then create the symbol ratings. You can also adjust the conversion formula to fit a smaller and closer percentage range.
Competing the Balanced Scorecard - Entering Objectives, Initiatives, and Data
The final step is to fill in the descriptive metrics , targets, actuals, and initiatives that will be undertaken to achieve the objectives . If you have any unused columns or raw data you wish to hide from the presentation view, simply hide the columns.
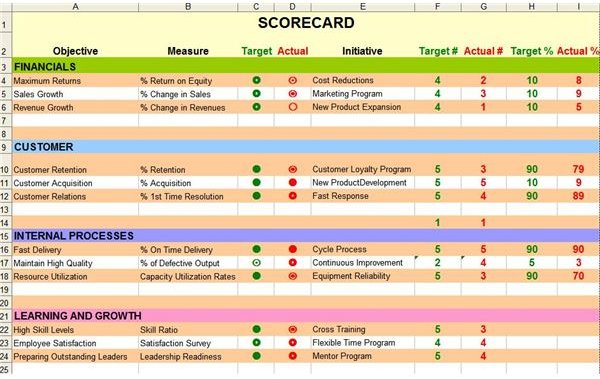
This balanced scorecard in Excel is complete with a few common metrics for each perspective is available for download and printing here from the Media Gallery.
This post is part of the series: Balanced Scorecards
Thinking about developing a balanced scorecard for your business? Learn more about these important analysis tools and find examples that you can freely download for your own personal or business use.


