
Computing analysis ratios is easy but interpreting them the way savvy financial managers do can be difficult. Delve into this guide to understanding and using accounting and finance ratios and use it as a ready reference in evaluating a company’s liquidity, profitability and efficiency
Why Deal with Ratios?
Business and finance managers make use of accounting ratios because they want to dig deeper into financial data presented as the results of business operations. They want to know how well their business organization fared compared to the previous years’ performance and in comparison to their competitors.
Accounting ratios serve as indicators of improvements or the lack of it, for which their company may be regarded as weak or strong based on industry standards.
Finance ratios, on the other hand, serve as tools for planning by determining the future inclinations and needs of the company. They make use of rates and percentages to map out business strategies aimed at steering their company’s operations toward growth and sustainability as a going concern. Since analysis ratios are regarded as financial indicators, they are often presented to business owners and key stakeholders to support propositions for investment ventures or to justify major acquisitions.
This means that in understanding and using accounting and finance ratios, one should also have an insight of the users’ objectives. Be guided in this aspect by the following articles, from which readers can gather more concrete examples of how and why analysis ratios are used:
- Fundamental Analysis for Beginners
- Ratio Analysis of Financial Statements
- Improving Your Skills for Analyzing Important Business Information
- Planning your Business with Managerial Accounting Ratios
- Who Uses Balanced Scorecards and How can Organizations Benefit from Them?
- How Economic Value Added (EVA) Relates to Financial Ratio Analysis
Understanding the Interpretations

In going about the analysis process, how does one interpret the resulting ratios? They may be numerical figures but they have stories to tell or exhibit tell-tale signs that foretell.
Basically, ratios are derived by dividing a particular value or number by a related value. This is done in order to determine a rate or proportion. Results are expressed either as (1) percentages, (2) number of times within a period, or (3) the equivalent number of dollars of a specific value for every one dollar value of a related item. They serve as indicators to evaluate the aspects of liquidity, profitability, productivity or efficiency of a business entity or organization.
Lending institutions, for example, look for clues about a business entity’s credit-worthiness by analyzing its liquidity and repayment capacity. Investors infuse money as investments but may find it necessary to divest or unload after careful evaluation of their portfolio. Managers have to present options and justifications to top-level management regarding the rationality of their recommendations.
Get explanatory guidelines from the following articles on how analysis ratios provide support in addressing such concerns:
- What Do Banks Look for in a Business Before Lending Money?
- Contemplating on Stocks Withdrawal or Stay Invested: Which is Better?
- What Ratios are Used to Evaluate the Value of Common Stock?
- Lease or Buy? How to Conduct an Analysis
Since we are offering this as a guide to understanding and using analysis ratios for both accounting and finance purposes, we will examine actual calculations and interpretations according to the aspects of liquidity, profitability and productivity or efficiency.
Liquidity

Can the business organization meet its upcoming obligations without resorting to borrowing? Large cash balances do not necessarily denote solvency. One must also look into the existing fixed assets, liabilities and working capital requirements of a business before arriving at reasonable conclusions about a company’s solvency.
Learn how from these reference guides:
- Overview of Solvency Ratio Analysis
- What Information Do Liquidity Ratios Provide?
- What is the Ideal Debt to Income Ratio?
- The Acid-Test Ratio: Examples & Calculation
- How to Calculate the Quick Ratio
- Application of the Cash Coverage Ratio
- Understanding the Net Tangible Assets Ratio
- Explaining Fixed Assets to Net Worth Ratio
- The Working Capital to Total Assets Ratio: Explanation & Examples
Profitability
Determining profitability is not just a matter of looking at the bottom-line figure of the income statement. A thorough analysis requires looking into the effect of the income on the entity’s cash position. An investor has to ascertain if the company is capable of paying reasonable or high rates of returns from funds generated by business operations.
Maintain an inquiring mind in evaluating income in relation to its selling prices and the use of its resources. The following articles furnish explanations about analysis ratios that probe deeper into the aspect of profitability:
- Determining Sales to Fixed Assets Ratios
- Gross Profit Ratio: Explanation & Examples
- Calculating & Interpreting the Gross Margin Formula
- Net Profit Margin Ratio: Explanation & Examples
- Contribution Margin Ratio Examples and Calculations
- Return on Assets Ratio: Explanation & Examples
- Perform a CVP or Cost Volume Profit Analysis to Determine Break Even Point
- Break-Even Analysis Example: A Step-by-Step Guide
Productivity and Efficiency
Key stakeholders are also interested in the company’s tangible and intangible resources and want to be assured they are being optimized to their fullest potential. Is there room for growth and expansion? If there are new ventures or innovations, is the business realizing the returns previously projected? If the company is showing signs of growth, to which resources are the increments attributed?
Find out how to unravel these pieces of information by learning the discipline from these resource materials:
- Performing a Return on Assets Analysis
- Accounts Receivable Turnover Ratio: Explanation & Examples
- Importance of the Fixed Asset Turnover Ratio
- Depreciation to Fixed Assets Ratio
- Understanding the Maintenance and Repair Expense to Fixed Assets Ratio
- IT Spending As A Percentage of Revenue: Noise or Real Value?
- Study Guide to Financial Statement Basics: Related GAAP Rules, Formats, and Analyses
References
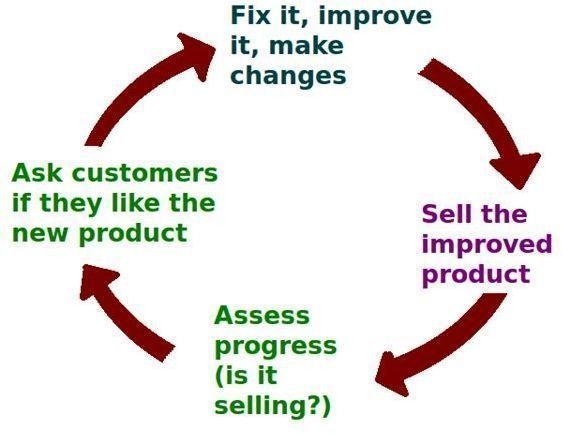
- Image: Business Feedback Loop - A business ideally is continually seeking feedback from customers: are the products helpful? are their needs being met? By Tomwsulcer at Wikimedia Commons CCO 1.0 Universal Public Domain .
- Image: The inverted pyramid of global liquidity.gif by Ashley at Wikimedia and to use it for any purpose including unrestricted redistribution, commercial use, and modification.
- Image: S&P 500 index and price-to-earnings ratios by El T at Wikimedia under public domain.
- Image: Aspect ratios by Indolencesat Wikimedia under public domain.
- Image: Percent 18e by Farmer Jan and bdesham at Wikimedia under public domain.


