If your best friend just got a great new job and you are thinking about refinancing your home at a lower interest rate, chances are the Consumer Confidence Index is on the rise. What makes up the Consumer Confidence Index and who collects the data? Jean Scheid takes a look.
Since 1985, The Conference Board has determined and maintained the Consumer Confidence Index or CCI. It is comprised by survey questions answered by 5,000 families each month.
In 1985 when the CCI first began, the Index was set at 100% as a benchmark. When the economy is down, survey results usually reveal the downfall through moderate to low index numbers; hovering between 40% and 50%. A good economy will show a higher index at closer to 90% to over 100%.
The surveys contain questions on how consumers feel about business conditions, the next six months expected business conditions, current and future employment conditions, and predictions on household incomes. According to The Conference Board, all questions are answered either “positive”, “negative” or “neutral”.
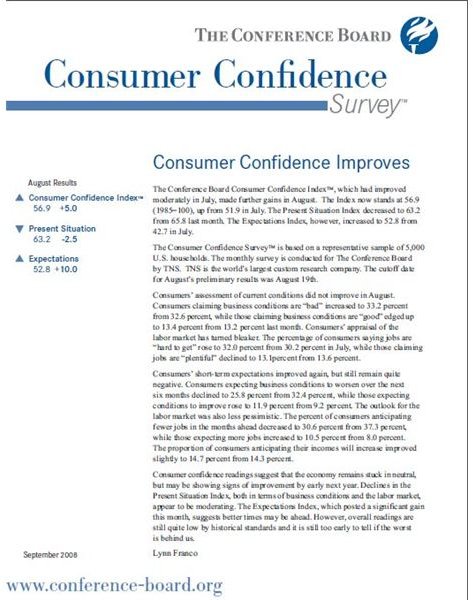
Forty percent of the CCI is based on what survey takers feel about the current economy and 60% is based on economic issues concerns six month into the future. A sample CCI Survey from August of 2008 can be found in our Media Gallery . A one-year subscription to all CCI surveys will cost you $455 and are emailed to you in a chosen .pdf or MS Excel format.
Image Credit: CCI Survey Screenshot by JScheid
Reading the CCI Survey
Questions are asked about employment, business conditions, and income levels. Survey participants are also asked if they are thinking about purchasing a new car, home, or major appliances. Questions are also posed regarding travel and vacation, inflation rates, interest rates, and the price of stocks.
People are next asked to choose an age range for the head of household and income range for the entire household. Finally, the area where survey participants live is identified and broken into nine regions:
- New England
- Middle Atlantic
- East North Central
- West North Central
- South Atlantic
- East South Central
- West South Central
- Mountain
- Pacific
Tables and charts are reflected on the CCI based by region and include consumer confidence on job related issues as well. Each of the charts and tables are based on calculations determined by the first year the CCI was obtained, 1985 or the 100% benchmark.
Who Uses It?
While all Americans should understand what makes up the Consumer Confidence Index, banks, big business, and local, federal, and state governments mostly utilize it.
If the CCI is increased or decreased by 5%, analysts say this largely goes unnoticed by concerned groups. Higher percentage changes aid groups in making decisions on pricing products, if consumers will buy products, if tax cuts or increases are recommended, and whether bank and financial lending opportunities are considered good or bad.
Why Should You Care?
The Consumer Confidence Index is a great indicator for business owners and consumers to determine when and where money might be spent or if it will be saved. Even home-based business owners should be concerned about the results and what makes up the Consumer Confidence Price Index. If the CCI is down, chances are your sales revenues won’t be strong. On the other hand, if the CCI is up, you may be able to charge a higher price for products or services.
Consumers who follow the CCI can better determine if big business will offer more incentives and discounts on mainstream products or if prices will remain at steady or higher than expected levels.
Everyone should care about the CCI. Download the CCI Sample Report and learn for yourself what makes up the Consumer Confidence Index or visit The Conference Board’s Glossary Section for more information.


