The Pareto Principle, 80/20 Rule, or the Law of the Vital Few has had business applications for over 100 years. Understanding the principle can improve your personal financial planning as well. In a general form, the principle states 80 percent of results come from 20 percent of actions.
What Is Pareto Analysis?
Vilfredo Pareto (1848-1923) was an Italian economist and gardener who formulated an economic principle that is still applicable today. In 1906, Pareto noticed that 20 percent of the Italian population owned 80 percent of the land and controlled 80 percent of the wealth in Italy. He also found 20 percent of the peapods in his garden produced by 80 percent of the peapods. Pareto went on to analyze other areas and found approximately the same ratio.
Another economist, Dr. Joseph M. Juran, in the 1940s found similar 80/20 examples in other areas and called it “Pareto’s Principle.” Juran also referred to this as a universal principle, which he named the “Vital Few and Trivial Many,” later revised to simply the “Law of the Vital Few and the Useful Many.” Juran felt it was dangerous to ignore completely the larger group in focusing on the “useful few.” Some examples are:
- In sales operations, 20 percent of the sales people will generate 80 percent of the sales;
- In customer relations, 80 percent of the complaints will come from 20 percent of the customers;
- In personnel offices, 20 percent of the employees will account for 80 percent of absences.
The rule is rarely exact and does not work with everything. For example, while 20 percent of the singers in an opera performance probably do the majority of singing and acting, 20 percent of the orchestra does not produce 80 percent of the sound. However, the Pareto Principle can provide some solid analytical guidance in areas that otherwise might have to rely on intuition or guessestimates. With a little effort and the use of a spreadsheet, you can apply the principle in several areas of personal financial planning as well as your daily life. Even if you do not go to the trouble of developing a spreadsheet, just a better awareness of how a high percentage of benefits in many life areas comes a low percentage of activities and conversely, why it is important not to overemphasize the less important areas.
Personal Financial Planning with the Pareto Principle
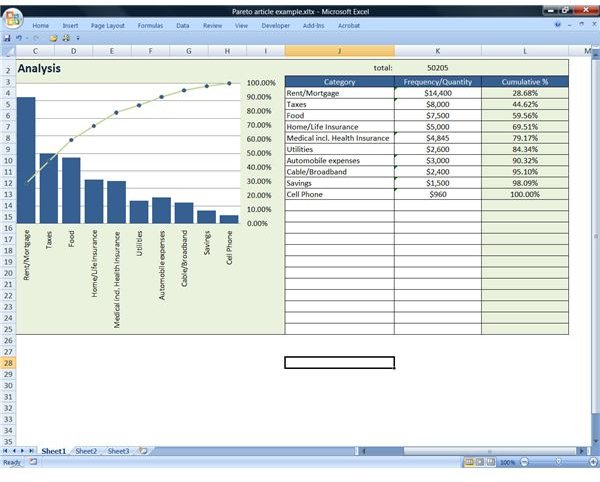
The easiest way to see the Pareto Principle in action is to look at personal expenses. It helps if you use some form of accounting software such as Quicken or Microsoft Money, because it provides a readily available form of your expenses or budget. Actually developing a spreadsheet for Pareto analysis goes beyond the scope of this article. However, “Creating Pareto Charts with Microsoft Excel 2007 ,” is an excellent tutorial available on Bright Hub that will teach you to create your own Pareto data and chart. The associated image will give you an idea of what an analysis of spending shows in Pareto form. The actual categories and amounts in the chart have no relationship to any real data; they are made up just for illustration.
Pareto Spreadsheet Data
Start your spreadsheet work by listing the major categories of outlay each month or a typical year total. You can make it as detailed as you like, but it probably is not worth the time to go overboard, for example, by including what you spend on a weekly Sunday paper unless this is a significant part of the budget. Typical categories might be:
- Rent/Mortgage
- Taxes
- Food
- Home/Life Insurance
- Medical including Health Insurance
- Utilities
- Automobile expenses
- Cable/Broadband
- Savings
- Cell Phone
Enter these in order from the
largest expense to the smallest in one column headed “Category.” In the next column, enter the yearly amount for the year. Label the column “Amount”. In the third column, headed “Cumulative”, enter in the first line a formula that takes the amount in the Category column divided by the total of all expenses, formatted as a percentage. In successive accumulations, change the formula so it adds the next amount to the first amount and divides the result again by the total yearly expenses. For example, if the first line in the Amount was in cell B1, and the total was in cell B11, then the formula would read “=B1/B11.” The second line in the cumulative column should be “=(B1+B2)/B11.” Format the whole column to display as percentages. The last step is to use Excel’s charting abilities to create a graph. Create the labels across the bottom and the round percentages on the right during the graph process, which includes both a bar chart and a line graph.
Analysis
From the chart and applying Pareto analysis, it should be clear how your expenses are distributed and the few categories that consume the largest amount. In this example, the first five areas (above the 20 percent level), make up close to 80 percent of the total expenditure. While you cannot do much about the Rent or Mortgage expense short of moving to cheaper quarters, it is clear that cutting the food expense, perhaps by shopping at large chains instead of specialty grocery stores could make a significant difference. Looking for some additional legitimate ways to save on taxes would also help in personal financial planning.
While you might derive the same plan just by looking at expenses in total, it may be that a concrete, statistically valid analysis using the Pareto Principle will give you more impetus for rational planning.
Additional Applications of Pareto in Everyday Life
To start you thinking about more ways to use the 80/20 rule, check out these ideas in a blog posting: Twenty Uses of the Pareto Principle
References
Arthur W. Hafner, Pareto’s Principle: The 80-20 Rule accessed June 22, 2011.


