Bollinger Bands are a well established technical indicator for security trading. Learn how to set them up and how to trade with Bollinger Bands.
Set Up Bollinger Bands
To learn how to trade with Bollinger Bands, take the steps of learning how to set up the bands on your price chart, analyze what the bands are telling you and develop trading strategies from the band signals. Bollinger Bands were invented by John Bollinger in the 1960’s using statistical calculations to plot a price range on a stock chart. Bollinger bands can be used for trading stocks, futures or forex.
Your charting software will have a selection in the technical indicators for Bollinger Bands. You can select the data for the bands, but it is best to start with the 20 bar simple moving average – SMA – and 2 standard deviations – SD. The chart software is probably preset with these settings. The Bollinger Bands will be three lines overlaid on the security price bars or candles. The three lines are the SMA in the middle, an upper band and a lower band. Most of the recent price history should lie between the upper and lower bands.
Analyzing Bollinger Bands
Bollinger Bands give a graphical picture of the price trend and volatility. 95 percent of all price action should be contained between the upper and lower bands. The SMA works the same as an other moving average indicator and will stay between the upper and lower bands. The width between the bands indicates the volatility of price action. If the bands narrow, volatility is low, widening bands show an increase in the volatility.
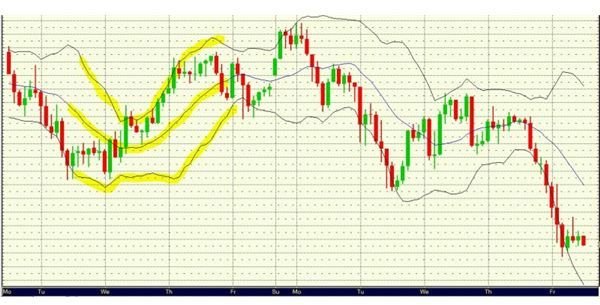
Notice the relationship with the price bars or candles and the upper band when there is a price uptrend. The top of the price candles will ride the band without breaking through by a significant amount. The same in a down trend. Analyze what happens when a trend breaks and the price crosses over to the other band. Trading using Bollinger Bands is sometimes more art that hard and fast trading signals. A trader uses the bands to get a feel for the upcoming price action.
Bollinger Band Trade Signals
Here are a couple of ways the Bollinger Bands can signal a trade entry point.
The Bollinger Band squeeze can be an indicator for a pending price breakout. Look for the bandwidth to steadily narrow, indicating reduced volatility. When the price starts to break out at the upper or lower band, enter a trade in the direction of the break. The price will break out of the Bollinger Band squeeze with a strong price move in one direction.
Another trade indicator, especially for stock traders, is a trend reversal from a bottom band breakout. If a price bar or candle moves strongly through the lower band, this can be an indicator of a oversold situation and the price could poised for an upward move. Band breakouts are signs of a possible reversal in both directions, but the lower band breakout for stock prices seems to have the most validity.
The SMA line can be used as an indicator to close an open trade. Once a trend has developed, the price will often stay between the SMA and the upper or lower band, depending on whether the trade was initiated long or short. A price move back across the SMA may indicate an end to the price move.
The Bollinger Band indicator be used with other technical indicators to help confirm buy and sell signals. Using the bands on a candlestick chart is a popular combination. Traders will look at the banks to confirm the signals indicated by the candlesticks. Learning how to trade with Bollinger Bands can be a challenge but very profitable if properly maintained.
References
Trading Strategies: Bollinger Band Tactics: https://trading-strategies.netfirms.com/trading/bollingerbandtactics.htm
Investopedia; Bollinger Bands: https://www.investopedia.com/articles/trading/07/bollinger.asp
MySMP: Bollinger Bands: https://www.mysmp.com/technical-analysis/bollinger-bands.html


