Trading the forex and flat market indicator strategy has long been the forte of experienced scalpers. This article explains what flat market indicators are and how they can be used to trade the forex market.
It is generally the intent of forex traders to trade the market when the chance of making good profits is highest. While good trading opportunities are not confined to bullish and bearish markets, these markets have clearer trends and provide the trader with a higher probability that his or her trade will be profitable. That said, traders will usually try to avoid trading flat markets, and for this they will need to use a forex and flat market indicator to tell them when to stay out of the market.
Forex and Flat Market Indicator
While it is impossible to tell who is trading the market and what trading positions they are taking, it is quite easy to tell when there is a lot of volume behind market moves by using a momentum technical indicator.
Momentum technical indicators measure the rate of change in a security’s price. As the price of a security begins to rise or fall, price momentum increases; the faster the price of the security changes, the greater the increase in momentum. Momentum indicators will start to flatten once the price movement becomes confined. This usually happens when trading volumes or liquidity begin to fall or the market starts to consolidate.
Popular Momentum/Flat Market Indicators
RSI as a Flat Market Indicator - The RSI (Relative Strength Indicator) is often used to identify when a particular instrument has become overbought or oversold. In general, it is also used to indicate when an instrument has moved in one direction too quickly and is due for a correction.
By default, the RSI indicator ranges from 0 to 100 and is drawn using the trading data from the last 14 periods (if the default settings are used). An instrument is said to be overbought and due for a pull back once the RSI approaches the 70 level, likewise, if the RSI reaches the 30 level and beyond it is said to be oversold.
If, however, the indicator is failing to reach the overbought (70) or oversold (30) levels, this is an indication that the market may be consolidating or is flat. However, this is not always the case, especially when the market is slowly trending in one direction without making big moves.
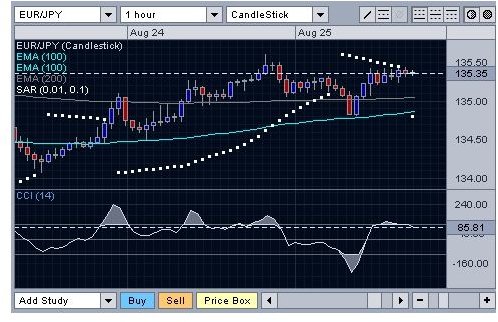
CCI as a Flat Market Indicator - The CCI (Commodity Channel Index) technical indicator is similar to the RSI technical indicator in that it is used to identify overbought and oversold instances of a security. Unlike the RSI indicator, the CCI shows overbought instances on a scale of –100 to 100. The instrument is said to be overbought when the indicator reaches 100 or greater and oversold when it reaches –100 or less.
The CCI technical indicator can also be used as a flat market indicator. The market is said to be flat when the CCI indicator is confined to a –30 to 30 range. Sometimes the market will cause this flat market indicator to temporarily overshoot the flat market range, but the flat market signal is confirmed when the indicator stays within this middle range.
Advice for Trading Consolidating and Flat Markets
When the flat market indicators are showing that the price of a currency pair is confined, traders are better off revising their trading strategy and profit levels. Instead, they should seek to identify if the market is consolidating and wait to trade when the market breaks out of the trading range.
In other instances, it may be profitable to try to trade the market using a scalping trading strategy. Regardless, trading with a forex and flat market indicator should only be considered if spreads are not too wide, to the extent that they impede or make profitable trading impossible.
Image Source
Image Supplied by the author. All Rights Reserved.


