In this article, we reveal a simple trading strategy to manually day trade the Forex market. It uses the RSI technical indicator and the engulfing candle stick formation.
Trading the forex market can be quite easy and profitable, if you know what trading opportunities to look for. The forex market handles more that $3 Trillion worth of transactions per day; with numbers like these there are lots of opportunities to be had, traders only need a good trading strategy and the discipline to follow it. In this article, we will outline a simple but effective RSI and candle stick simple strategy to manually day trade forex market opportunities.
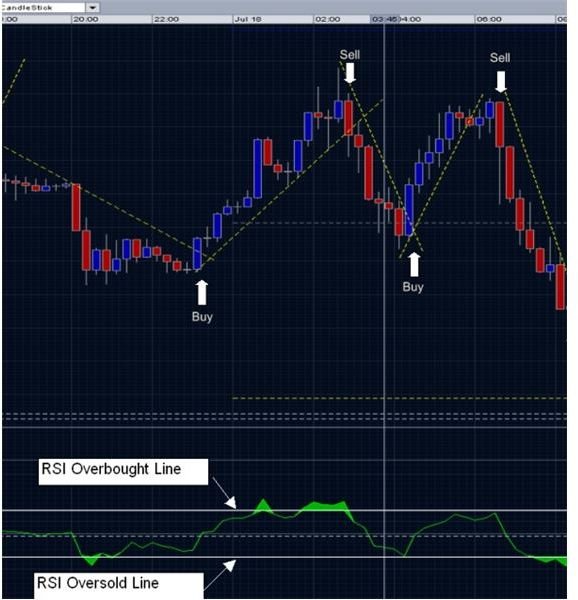
RSI and Candle Stick Trading Strategy
In this strategy we will use the RSI indicator, and chart patterns. In essence we are looking for trades where the market has become overbought or oversold. The chart below shows four good trading opportunities. Notice that the buy and sell signals occur after the market had reached overbought and oversold levels on the RSI indicator. The resulting trade signals are engulfing candlestick patterns that show up as a decisive reversal of the previous price movement.
These patterns don’t occur very often, but if you are lucky and patient you should be able to find at least one per day on one of the major currency pairs. Just in case you are wondering when is a good time to look for this chart pattern; they generally show up after economic news releases, or when the major markets are open, i.e. New York and London.
Figure 1. RSI Engulfing Candle Stick Pattern
Conditions for entering a trade with this strategy:
- The market makes a decisive move in a new directions.
- The resulting candle engulfs at least one candle to the immediate left.
- The market was overbought or oversold prior to the englufing candle pattern.
- The move seems to be a response to a major news release, such as economic data.
Money Management
The best trading strategies are the simple ones that use two or more indicators to verify trade setups. While no trading strategy is correct 100% of the time, if you use good money management you can still come out on top, even if you experience a loosing streak. A discussion on money management is beyond the scope of this article, but if you don’t risk more than 2% of your account balance at any time, you should do well.
Improving Your Trading Signals
You can use other indicators to further improve the quality of the trade signals you are getting. Please do not enter a trade every time you see one of these patterns show up. You should use other indicators to determine whether the trade is likely to fail because the price movement has come upon a significant support or resistance level. In any case, if the trade feels right take it. One of the best ’technical indicator’ you will ever have is gut feelings.
Another technical indicator that you can use to identify major support and resistance levels are Pivot Points. As a result, this technical indicator can help you identify good trading opportunities. We won’t go into a discussion on how to use of Pivot Points here, but you can have a look at this resource on Pivot Point trading strategies . You may find that moving average can also be quite useful in determining the market trend, and support and resistance levels.
A trade is confirmed as having a high probability of success when more than one indicator confirms the trade setup. However, you must be careful not to use too many indicators at once because they may cause you to second guess taking a very good trade opportunity.
As you become more comfortable with trading, you will want to look at more advanced trading strategies and concepts, such as the impact of the carry trade on price movements and also how a Central bank’s monetary policy can affect the markets, but for now this simple strategy to manually day trade forex market should give you enough trading opportunities to keep your trading account growing.
Image Source
_RSI Engulfing Candle Stick Pattern. (_Image supplied by the author; all rights reserved.)


