Do you want to be a better day trader? Understanding the Time and Sales screen is a great start.
Introduction to Time and Sales
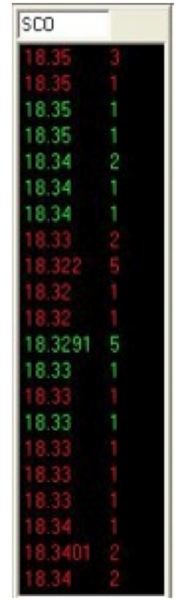
Above is an example of a time and sales screen (click to enlarge). The screen is used in tandem with the Level II screen . Time and sales is a list of every transaction that has occurred for a particular security. The SEC requires every transaction to be listed and visible to everyone. This means that most of the time (99%), transactions are posted on the time and sales screen as soon as they happen. Although he Level II screen can mask intentions by fake order sizes or even invisible orders with new dark pool routes, time and sales allows for a realistic view of market intentions.
Time and Sales Components
Looking at time and sales example at the top of the page, you can see various prices than are either green or red. The green quotes represent transactions occurring at the ask price. Red quotes represent transactions occurring at the bid price. Next to each price is a number. These numbers represent 100 shares blocks. For example, the last transaction was 18.35 for 300 shares at the bid. The time and sales screen is constantly changing, as new orders are placed at the top and cycled downwards. You can use this to your advantage because if you see a string of green quotes, it’s obvious that there is buying power present. The same is true if you see several consecutive red quotes, which would imply selling pressure.
Using Time and Sales
Since the screen is constantly moving it is impossible to see every quote. Yet, you can still get a general sense of the stock’s short-term direction. Another thing to note is the speed at which the transactions are occurring. If you see several green quotes in quick succession (faster than normal), it shows that there is volume behind the buying movement. Volume is one of the most important indicators of a a trend’s strength. At the same time, if the quotes begin to slow down, a reversal of direction may be approaching. Low volume implies either no interest or indecision in the current trend, and it is usually best to wait until a significant trend has established itself. Lastly, the greater the size, the more influence it has. Seeing 10,000 shares being bought at the bid is more important to future price movement compared to 100 shares being bought at the bid.
Conclusion
It is important to realize that the use of the time and sales screen isn’t a strategy in itself. Time and sales simply shows the trader a list of recent transactions. This list of transactions is a tool to help time entry and exit points. It allows the trader to take a quick look at price action to get a better idea of the short-term trend of the stock.


