In the amazing world of foreign exchange currency trading, the forecasting of the future trends and price variations of the currencies are extremely important. Two of the important financial indicators used in the foreign exchange trading market are support and resistance levels.
Technical Analysis in Forex
Technical Analysis in the currency trading market deals with the prediction methodologies based on the past performances and indicators of the forex market. As the factors affecting the fluctuations and trends in the foreign exchange currency markets are huge in numbers and also the behaviors of the price variations are not linear with respect these factors, it is very difficult to have accurate forecasting using technical analysis.
Graphs, Charts and Indicators
There are many types of indicators giving the important signals of the future market behaviors. Technical analysis can absolutely help the investing community to expect the likely happenings in the market. The expected price ranges and variations of trading currencies can be accessed through the technical analysis with a high level of confidence. Technical analysis makes use of varieties of charts, data, lines and statistical tools to get the good predictions of the price ranges over time. Price charts are always used as the prime sources for the technical analysis. Even if you equip with highly advanced software codes and analysis technique, you will be going through the charts and pictorial information to get the basic trend of the market.
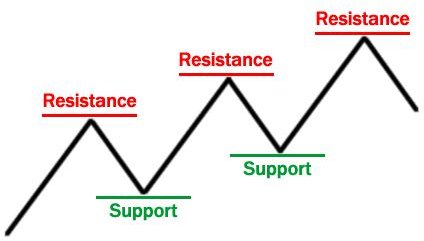
Support and Resistance
Support and Resistance
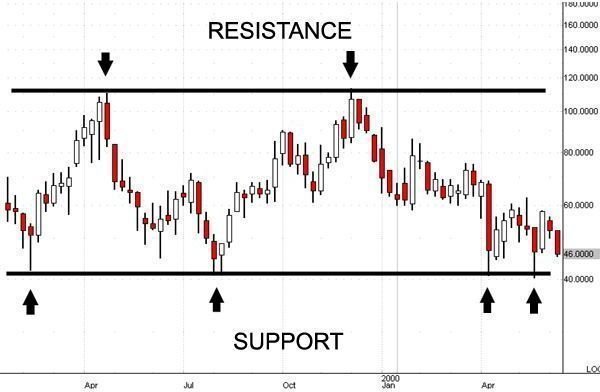
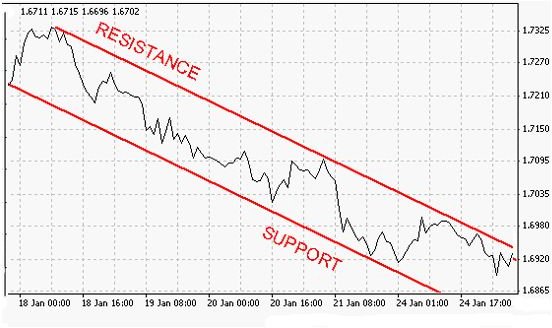
Two important terms used in the technical analysis of currency trading are support and resistance levels. These are the top and bottom lines in the charts. These are the temporary limiting lines for the currency prices. Support levels indicate the demand and the resistance levels indicate the supply. Support and resistance levels are characterized by the periods in which trading moves within a confined range indicating the deadlock of supply and demand. When a breakout comes either supply forces dictate the market or demand forces dictate the market. Here the currency prices will go out of the confined ranges of supply and demand. At the support level traders can expect the market to go up. This is the field of buyers. Resistance levels are just opposite to the support levels. It is the top most ceiling in the forex charts. This is the field of seller’s market. When the price ranges meander around the resistance levels traders start taking profits by selling their instruments.
The Technique
Simple chart analysis can help identify support and resistance levels. Support levels and resistance levels provide the trading ranges in which you can go for currency trading very confidently. Technical analysis can help you in spotting these two levels together with any types of breakouts in the currency market. It is advised to wait for a breakout at resistance level to increase the returns. Similarly it is advised to buy currencies at the support level to get lucrative returns from the market.
References
https://ms-www1.marketscreen.com/help/AtoZ/default.asp?hideHF=&Num=49
www.forexondemand.com/support-resistance.html
stockmarketindian.com/nse_bse_technical_analysis_charting.html
stockcharts.com/education/Overview/techAnalysis1.html


