Candlesticks are a popular charting method in stock markets. These charts have been in use for many years in the financial markets. Candlestick depict the movements of the market and is very easy to read. The decision of stock buying and selling can be made easier with the candlestick chart.
Overview
Use of candlesticks in the economic investment field can be traced back to 17th century by which period the Japanese started analyzing the pointers from the financial markets technically. During 1900s there existed methodologies of technical analysis in US as well, even though the methodologies are different, all underlying principles are same or similar. The basic principles include price is important than asking why it has come. The price will be a function of all the known information. The financial market always moves with the expectation and feelings of the buyers and sellers. All the movements in the markets including buying and selling are basically guided by the desire to make profit. The actual market price need not reflect the actual worth or underlying value. It is not essential for somebody to loose money for somebody else to gain money. All these features can be observed in the stock markets and foreign exchange currency markets.
Some history
The original or primitive ideas of candlestick charts in financial market took shape during 1850 and were the brain chills of a rice trader named Homma. It is true that the original ideas hand the way in which candlesticks are used has undergone evolutionary changes during the long period of more than 150 years. But still the underlying principles and guiding spirits of the candlestick charts have not changed much.
Understanding the candlestick chart
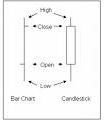
Candlestick is generated from the data consisting of Open, High, Low and Close prices of the stocks for the period you want to do the analysis. Most of the investors like to get the candlestick charts depicting the most recent and current OHLC data. Candlestick charts contain filled regions and unfilled regions. The filled region is known as the body of the chart and the unfilled region or region with the thin lines above and below the body are regions of high and low fluctuations known as shadows. If you want to read the candlestick chart, you can see that the price movements in the body region are more consistent and mostly risk free for investment. When the market is either in high or low shadow region, you have to take risks much in investments.
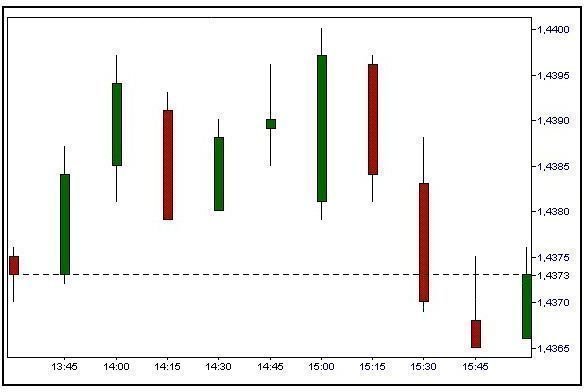
In the candlestick charts candlesticks are drawn from the open price to close price. One should know the convention of candlestick drawing to analyze and interpret perfectly the charts. If the stock close at a higher price than that of its opening price a hollow candlestick is drawn with the body bottom showing the opening value and the top of the body showing the closing price. In the other case of the market, when the closing price is less than the opening price, a filled candlestick will be drawn with larger value of open at the top and the close at bottom of the body. Many times the green candlestick is used instead of a hollow bar (increase in stock price during the period) and the red bar substitutes the filled bar – showing loss of value.
Ths usage
Being an alternative form of OHLC bar chart, candlestick is, of course, a very useful tool for stock analysis. The representation is even easier - thus the recognition of certain “technical model” is more simple - providing the investor with more tools to make the right decision regarding certain stock or currency. These graphs are often used with moving averages and other trailing and leading indicators.
Candlestick charts